Performance level data can be displayed within Quick Views. District administrators should configure test types to match the ascending order requirement for performance levels.
For individual student views, percent scores will show up to two decimal places to visually clarify why a student did or did not achieve a performance level. Quick Views do not round percent scores to assign performance levels, allowing for the most transparent understanding possible for a student’s performance.
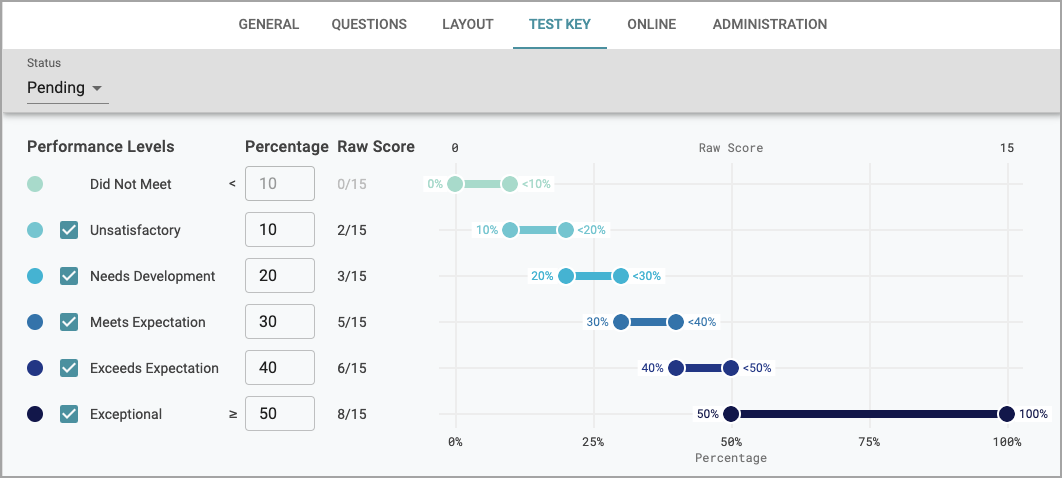
In scenarios where a student does not earn a performance level by a very small margin of error, test authors can change the percentage thresholds for the performance level in the Test Key. Any changes made to an active assessment will require a rescore.
Performance Level Data Views
Performance level data fields will be located in the Scores folder. Drag and drop the fields you wish to analyze into the view. Selected fields will alter the display of the assessment.
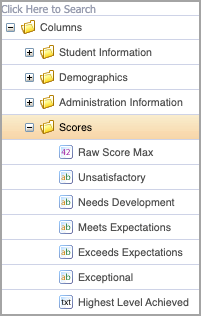
Highest Level Achieved
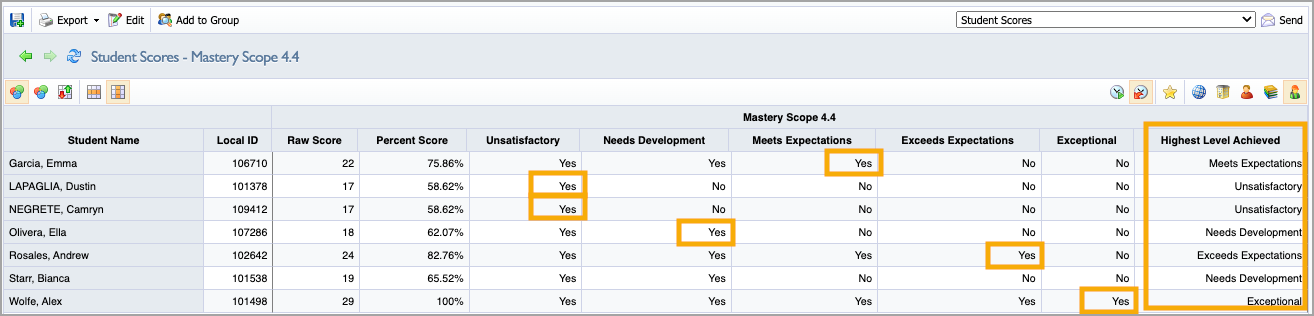
The Highest Level Achieved field shows the highest performance level a student earned based on their assessment score.
When you add this field to a test view, this column displays the text associated with the performance level. If you edit an assessment or modify student scores, you will be required to rescore to show changes in performance levels for Highest Level Achieved.
Note: Highest Level Achieved applies to local tests only. The column represents the highest level earned based on the position or number of the performance level rather than the numeric value. When setting performance levels for an assessment, it is important to put performance levels in numeric order for data to display accurately.
All Five Performance Levels Set
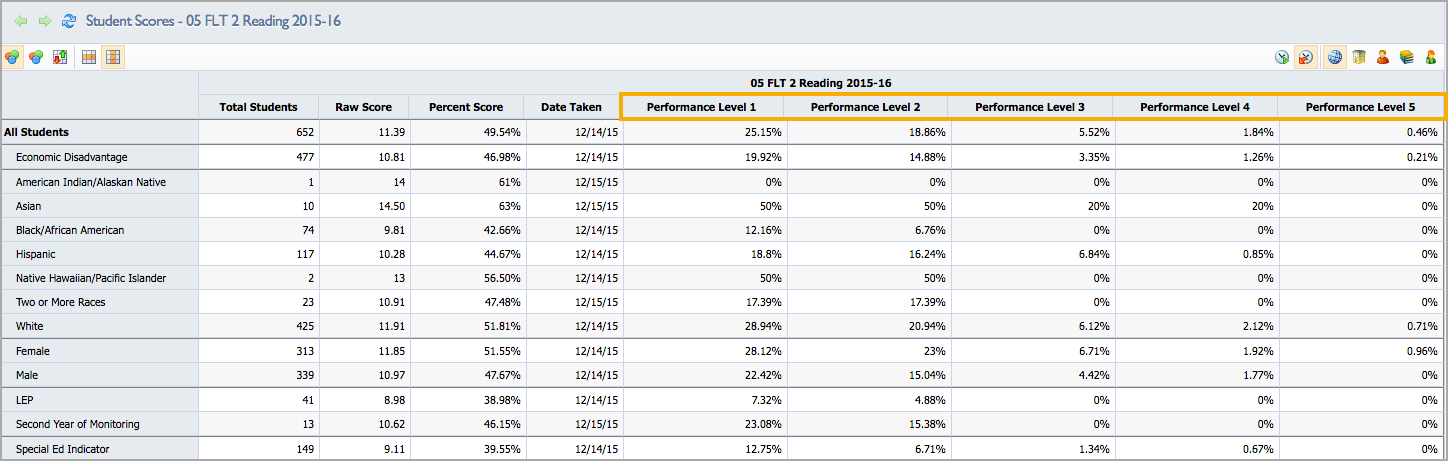
If all five performance levels are set for an assessment, then the data display will include the percentage of students achieving each level of performance. If a student has reached the fifth performance level, then they will also be included in the data for performance levels 1-4. The percentage of students in each performance level should decrease or remain constant from performance levels 1 through 5.
In the image below, 25.15% of students scored at or above the Performance Level 1 threshold. That means 74.85% scored below Performance Level 1, and a portion of the 25.15% also reached Performance Level 2, Performance Level 3, Performance Level 4 and Performance Level 5.
Caution: Deactivating performance levels and changing percent values for a test will still allow users with view editing abilities to summarize results. Assessments' performance level fields will summarize with the same fields in other tests, while missing fields in one test will simply be missing from the summarized view.
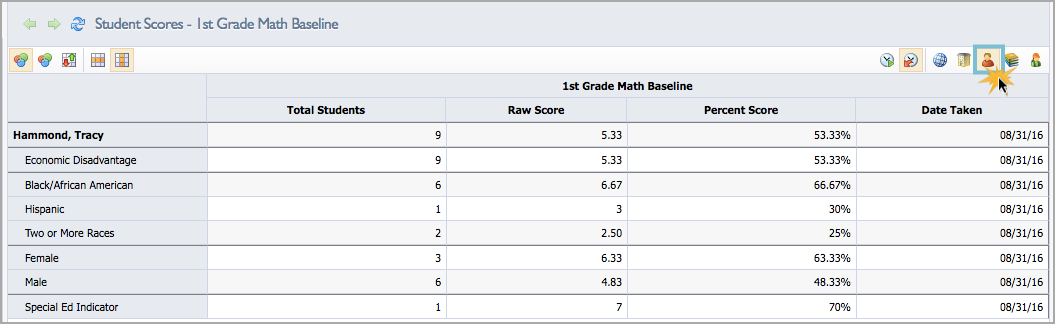
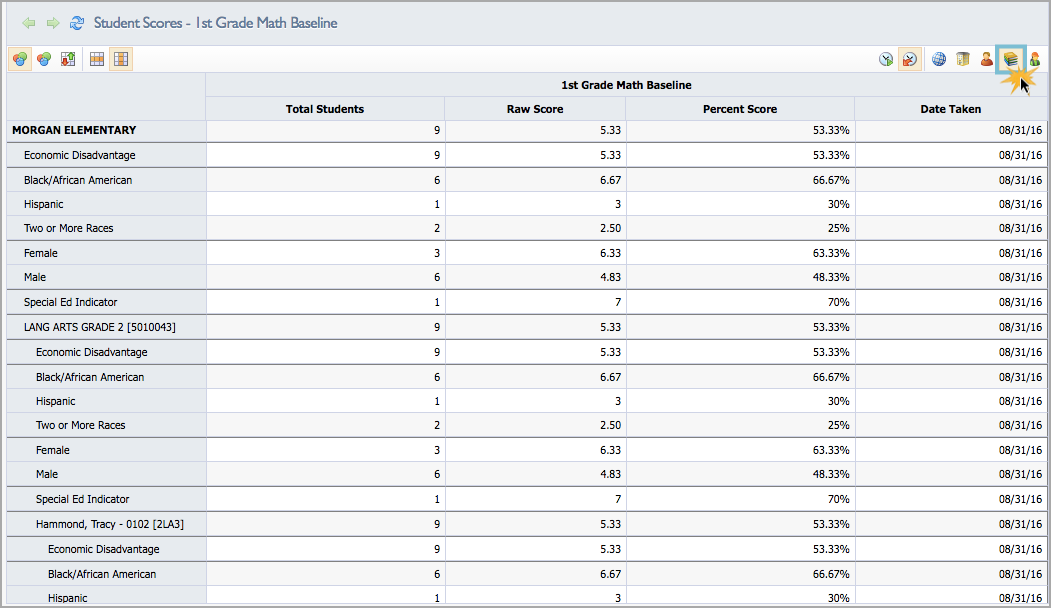
No Set Performance Levels
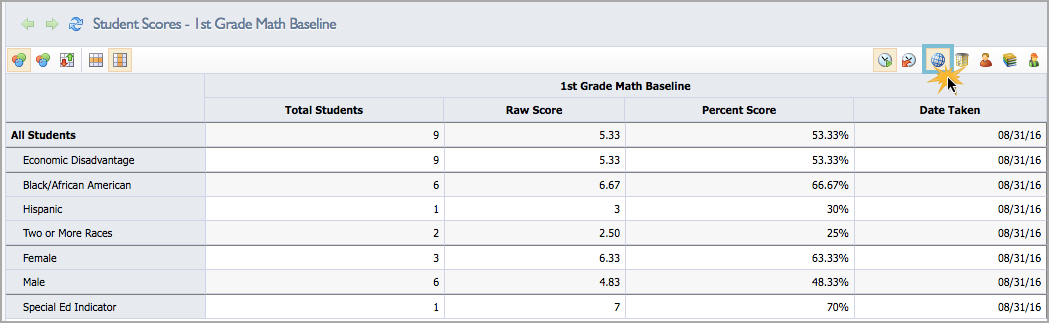
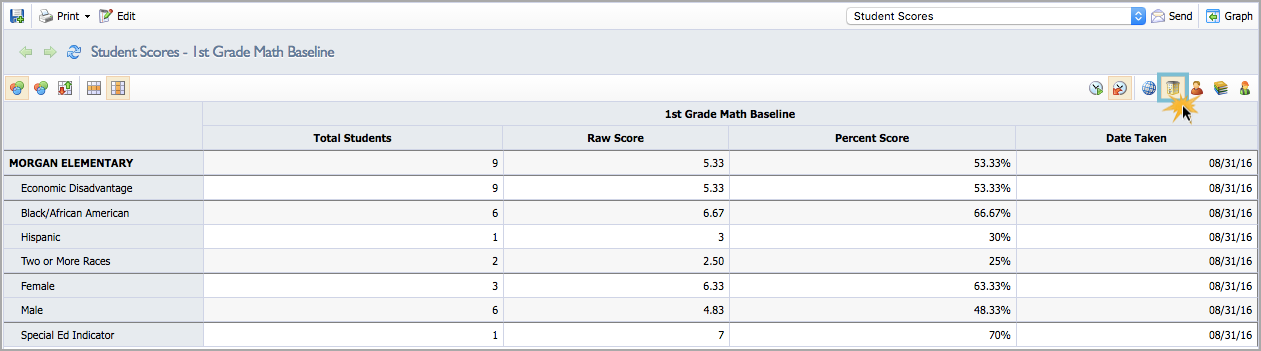
An assessment without any performance levels will display default fields for the district, campus, teacher, section, and student level views.
District Level View
Campus Level View
Teacher Level View
Section Level View
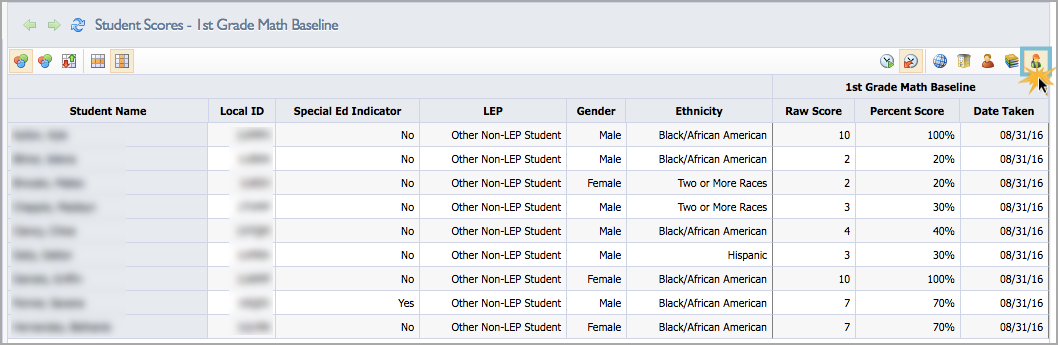
Student Level View