.png)
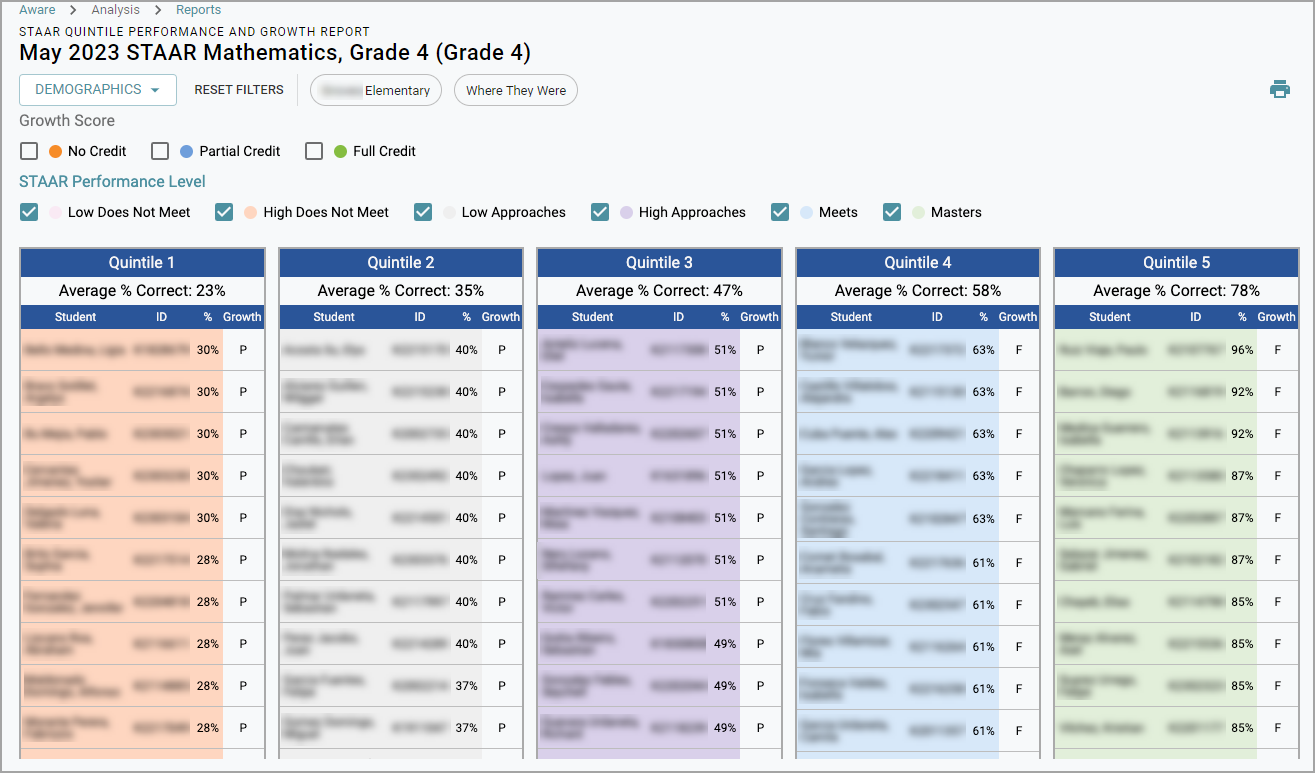
The STAAR Quintile Performance and Growth Report is available to teachers linked to an SIS account, principals, and district data viewers. This report utilizes STAAR assessment data and distributes students into five equal groups, or quintiles, with an Average % Correct data displayed for each quintile.
In addition to the quintile breakdown of students, the STAAR Quintile Performance and Growth Report includes the following functions:
Performance Level selections and highlighting
Student Growth credit levels and highlighting
Student demographic selections
Note: STAAR Early Results do not work with the STAAR Quintile Performance and Growth Report.
Grouping and Filtering Options
The STAAR Quintile Performance and Growth Report allows users to select the desired grade level, subject, and year. Below is a list of all of the grade levels and subjects available for this report grouped by the type of analysis available.
STAAR Quintile: Annual Growth and Performance
Spring 2023 STAAR administrations and beyond display Annual Growth data for applicable grade levels. Cut scores for each performance level are based on the year selected. Users can group the following grade levels and subjects by both annual growth and performance:
Grade 4 Math
Grade 5 Math
Grade 6 Math
Grade 7 Math
Grade 8 Math
Algebra I
Grade 4 ELAR
Grade 5 ELAR
Grade 6 ELAR
Grade 7 ELAR
Grade 8 ELAR
English I
English II
Grade 4 SLAR
Grade 5 SLAR
STAAR Quintile: Performance
Users can group the following grade levels and subjects by performance only:
Grade 3 Math
Grade 3 ELAR
Grade 3 SLAR
Grade 5 Science
Grade 8 Science
Grade 8 Social Studies
Biology I
US History
Demographic Data Filters
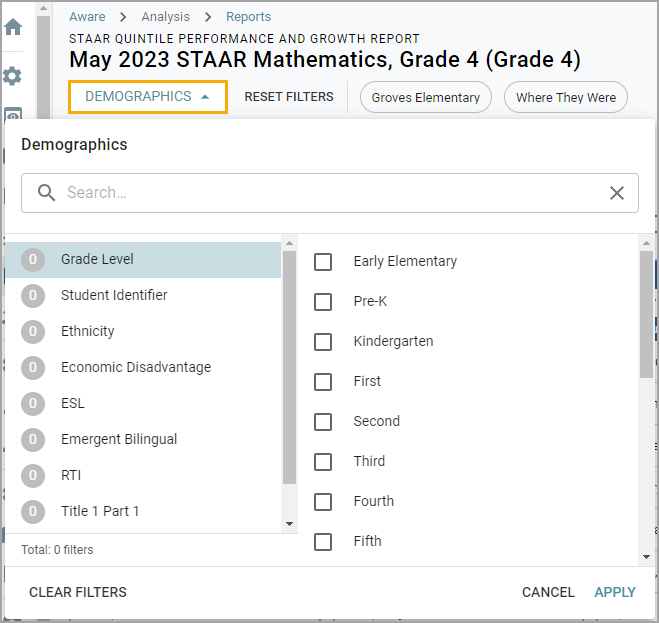
Users can select additional filtering options to highlight students associated with selected demographic groups in the report table.
The Demographics drop-down menu includes various nested filters that branch from the following options:
Grade Level
Student Identifier
Ethnicity
Economic Disadvantage
ESL
Emergent Bilingual
RTI
Title 1 Part 1
Career and Technology Ed
Once applied, the table will display in bold the names of the students who match the chosen demographic.
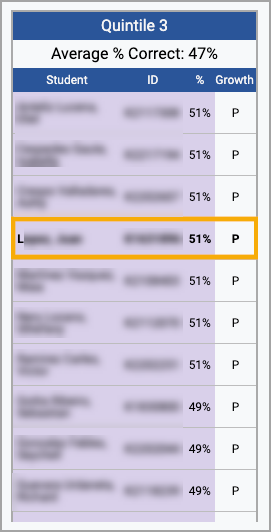
Note: It is recommended that only one demographic be selected at a time. The interface does not differentiate between multiple demographics when more than one is selected.
Creating the STAAR Quintile Performance and Growth Report
Users can locate the STAAR Quintile Performance and Growth Report under Analysis in Aware. A teacher’s workflow varies slightly from an administrator’s, with differences noted throughout the instructions.
Step 1: Select Reports.
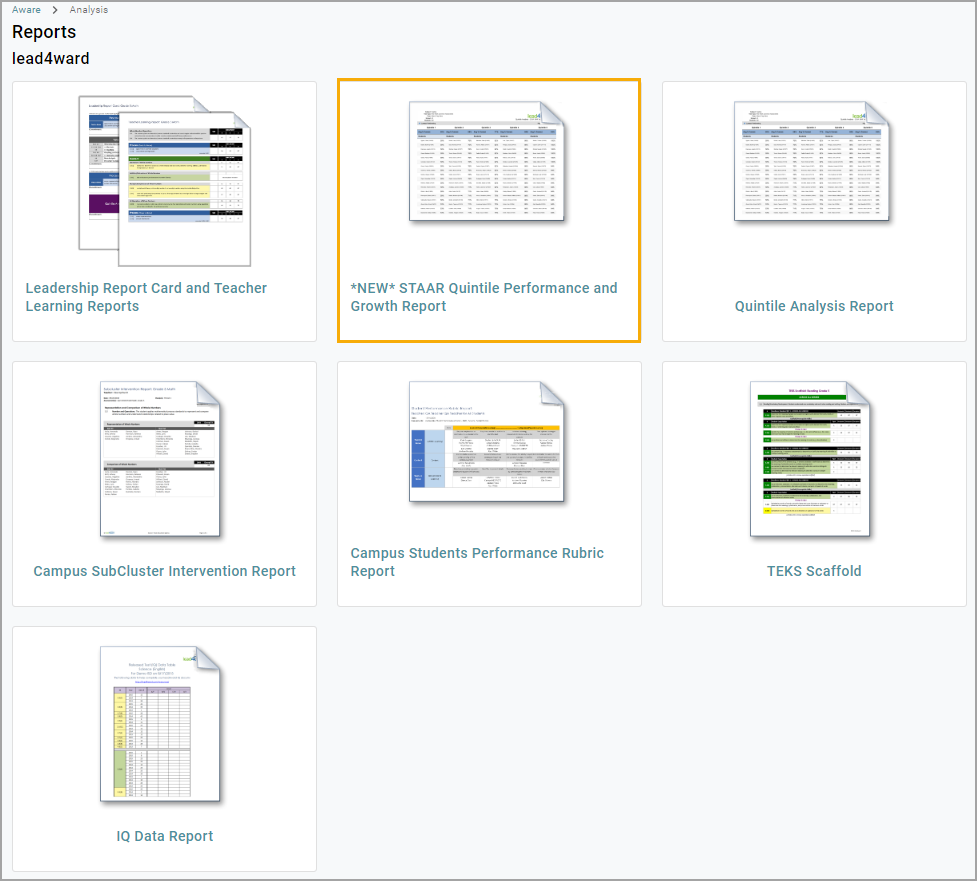
Step 2: Select STAAR Quintile Performance and Growth Report among the lead4ward reports.
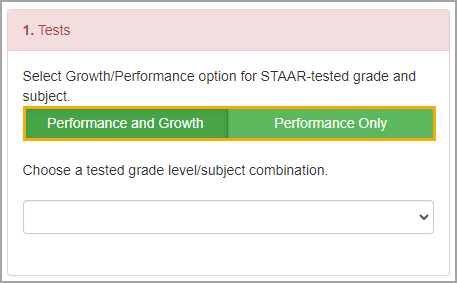
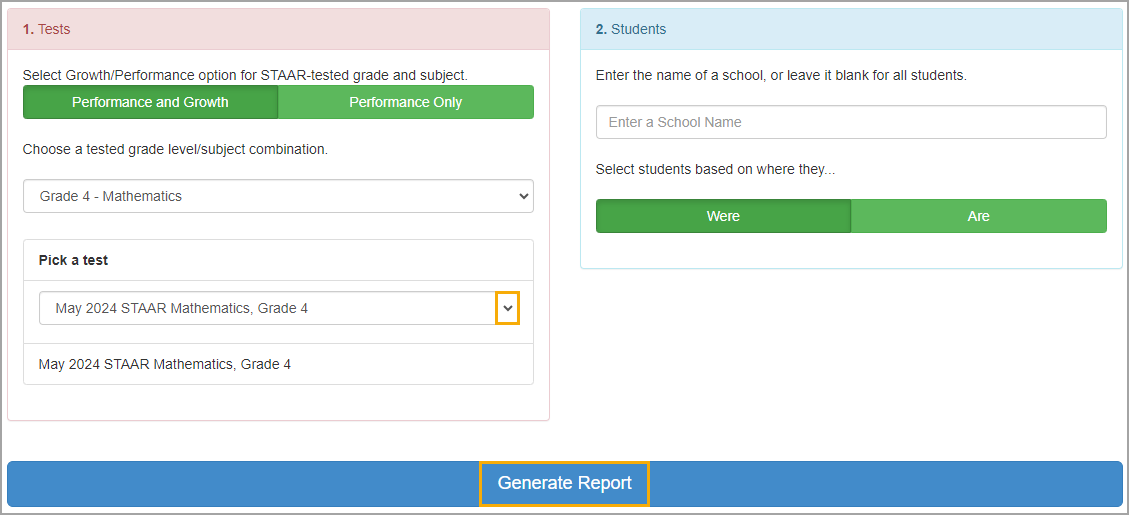
Step 3: Choose Performance and Growth to run a report that includes a STAAR-tested grade and subject, or choose Performance Only to run a report that only includes performance analysis.
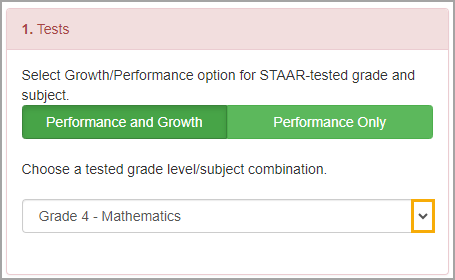
Step 4: Select the desired tested grade level and subject combination. The options will differ based on your prior selection.
Step 5: Administrators can specify a school or leave the option blank if they want to include all students. Then, they can select students based on where they Were or where they Are.
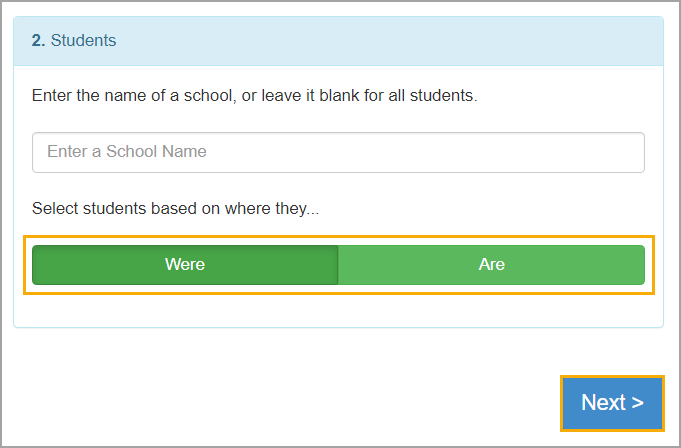
Teachers can include all their students in the report or filter students by class period.
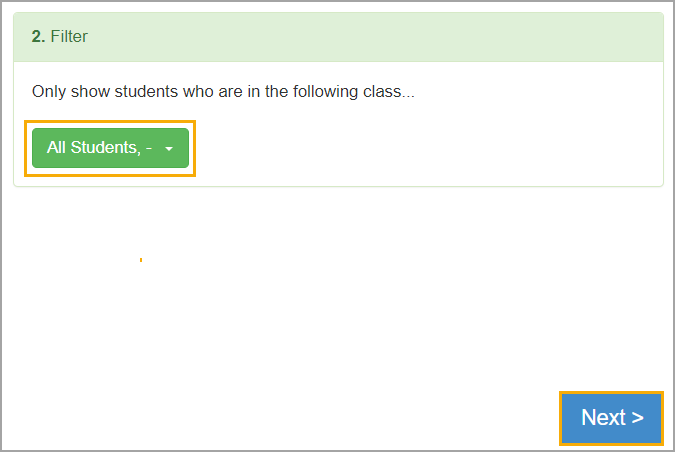
Step 6: Select Next, pick a test from the drop-down menu, then select Generate Report.
Student Growth Calculations
Student growth is reported as Full Credit (F), Partial Credit (P), or No Credit (N). Eduphoria’s calculations match those of the Annual Growth Points tables provided by TEA.
Students who do not have two consecutive years of STAAR data will not receive a growth score. Students without the selected year’s STAAR score will not be displayed.
Students with 0 points earn No Credit (N), half points earn Partial Credit (P), and 1 point earn Full Credit (F). An example of the table is below:
Current Year Performance on STAAR | ||||||
|---|---|---|---|---|---|---|
Prior Year Performance on STAAR | Low Did Not Meet Grade Level | High Did Not Meet Grade Level | Low Approaches Grade Level | High Approaches Grade Level | Meets Grade Level | Masters Grade Level |
Low Did Not Meet Grade Level | N | F | F | F | F | F |
High Did Not Meet Grade Level | N | P | F | F | F | F |
Low Approaches Grade Level | N | N | P | F | F | F |
High Approaches Grade Level | N | N | N | P | F | F |
Meets Grade Level | N | N | N | N | F | F |
Masters Grade Level | N | N | N | N | N | F |
Interactive Features of the Report
The STAAR Quintile Performance and Growth Report includes interactive features that allow users to customize the visual prior to printing. Users can select various combinations of performance categories and growth metrics, if available, and various demographics.
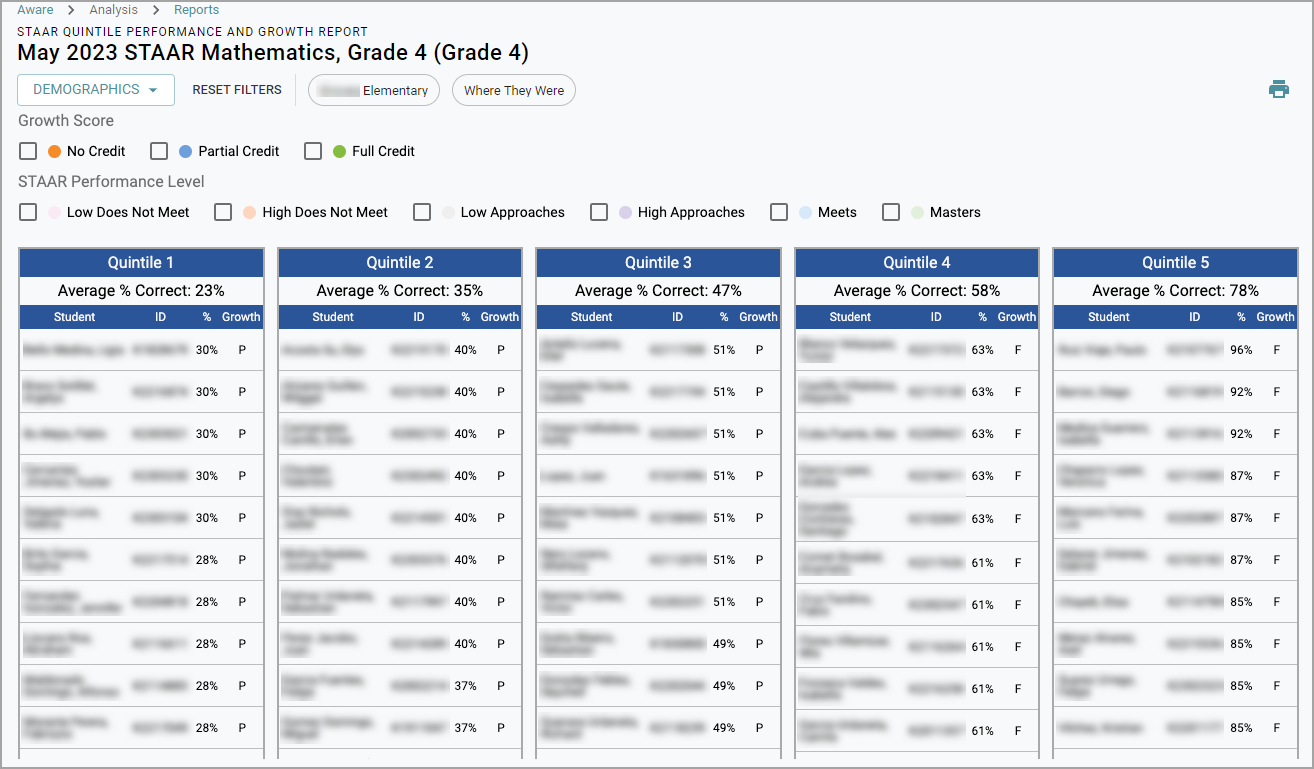
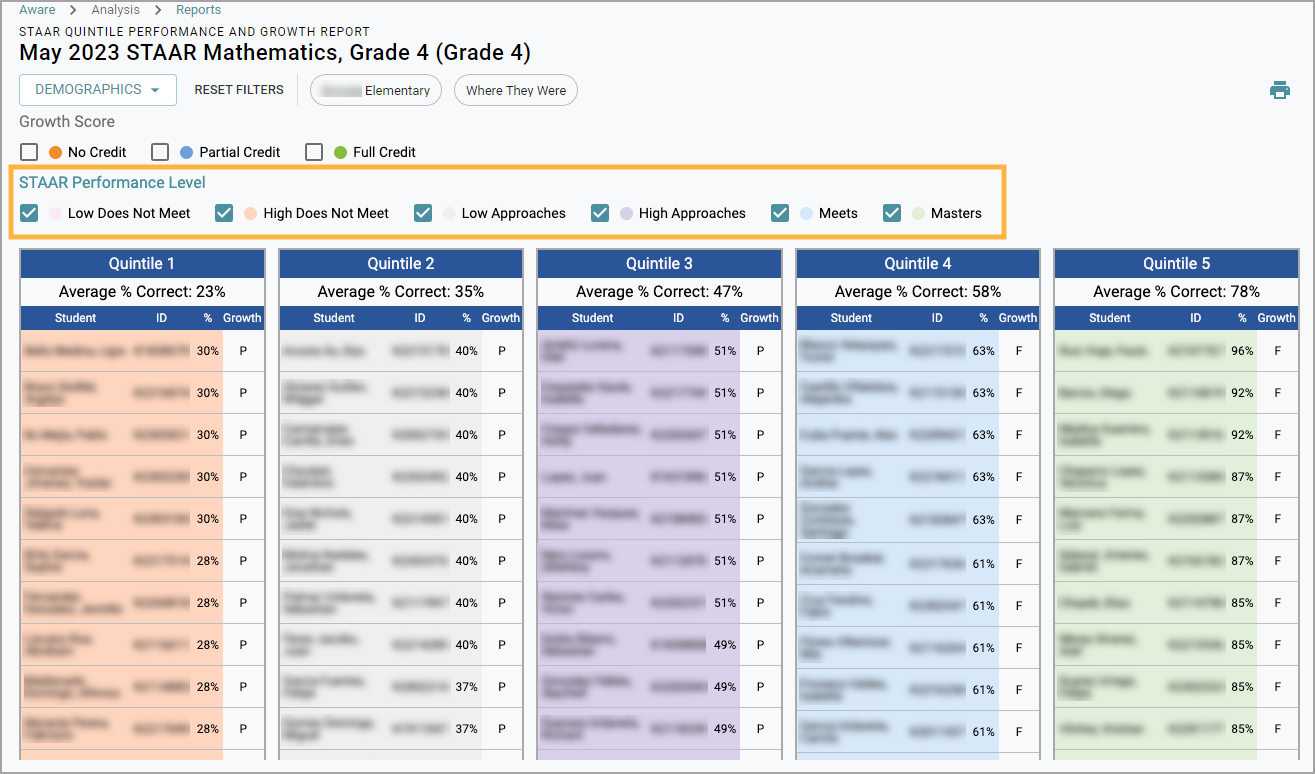
Highlighting Performance Categories and Growth
Above the table, select one or more of the following STAAR performance levels or leave all selections blank:
Low Does Not Meet
High Does Not Meet
Low Approaches
High Approaches
Meets
Masters
Checking the box for the desired levels will highlight each selection with the designated color. Colors are not customizable.
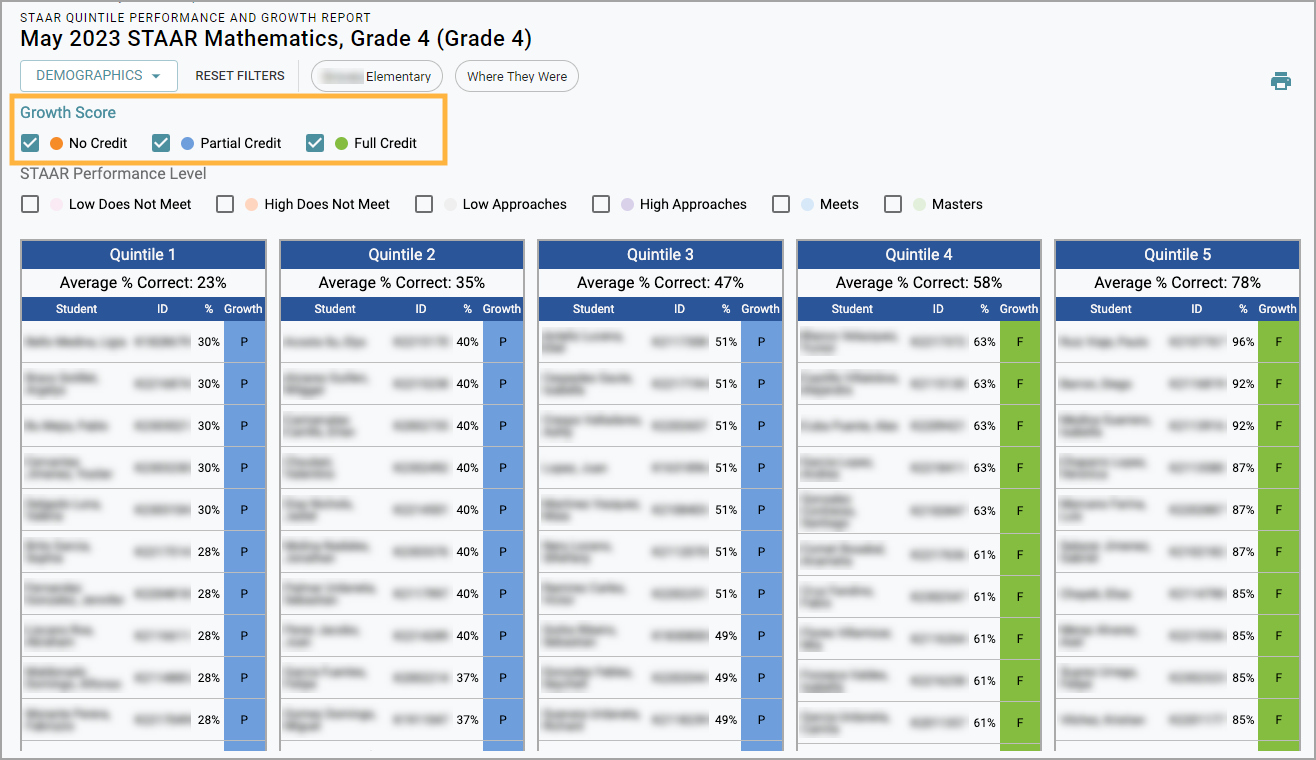
Select one or more of the following Growth Scores or leave all selections blank:
No Credit
Partial Credit
Full Credit
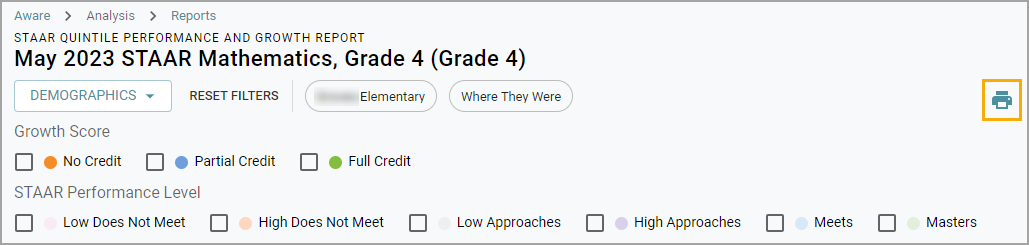
Printing Options
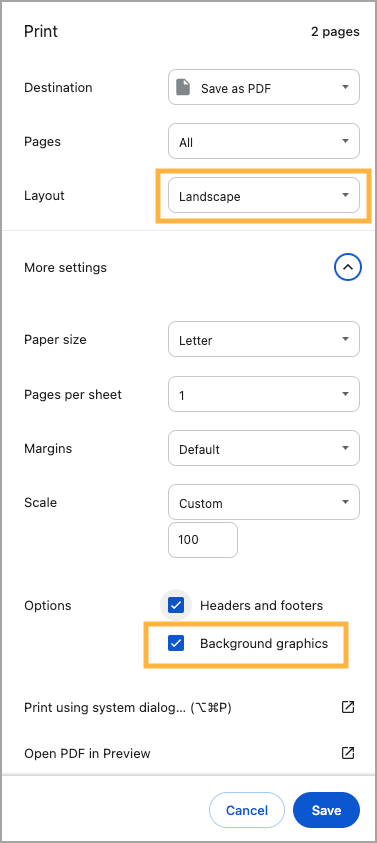
After you have made your selections in the report to highlight desired performance levels, growth scores, and student demographics, you can print the report using the Print icon.
Note: While using the Chrome browser, it is highly recommended that users print in Landscape layout and with Background Graphics toggled on. Users on other browsers will need to adhere to similar settings. Printing with other settings is not fully supported.