Reports
Click on Reports under Analysis to access all lead4ward, Accountability, and Summary Data reports.
Reports for Administrators
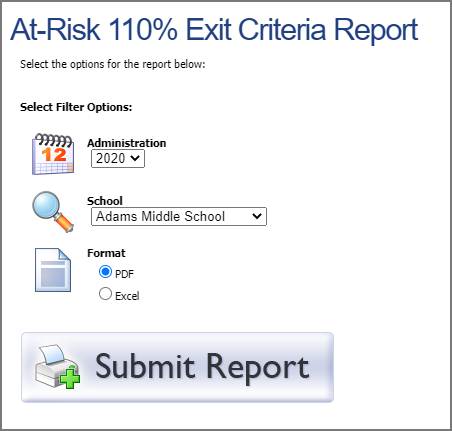
At-Risk 110% Exit Criteria Report
This report will help district and campus staff with one criterion to monitor the at-risk status of their students. The report will generate a list of students currently listed with the At Risk status in Aware and compare previous and current state assessments. The report will tell if the students have met their passing standard by 110% using their raw score. This report is available for students currently identified as at-risk and with the previous two years’ state assessment data in Aware.
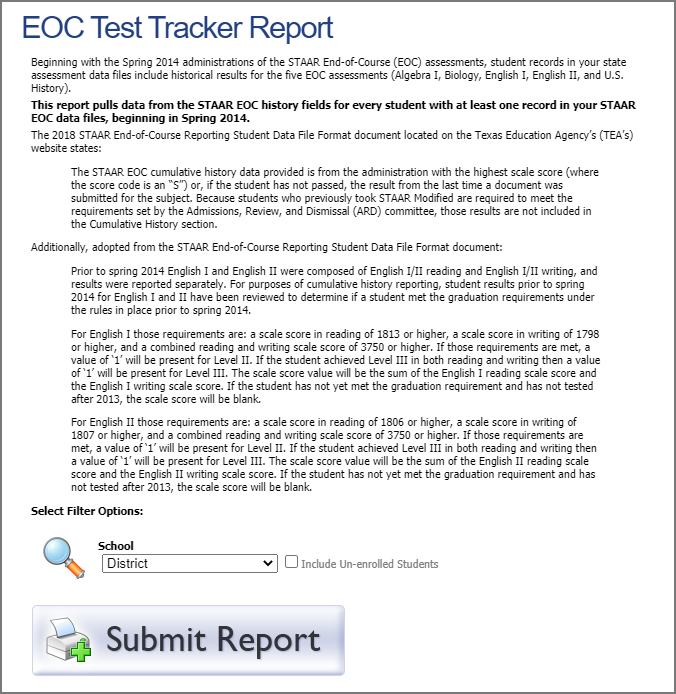
EOC Test Tracker Report
This report is designed to assist campus and district-by-campus staff with identifying students needing intervention or retesting for EOC administrations.
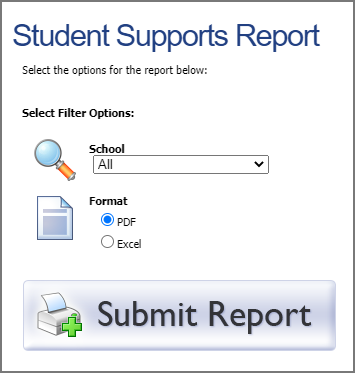
Student Supports Report
This report allows you to view any active student supports for online testing. A "1” indicates that a support has been turned on for that student.
lead4ward report descriptions are also available.
Reports for Teachers
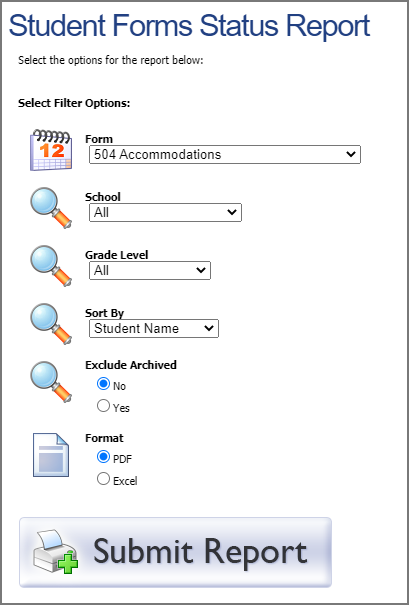
Student Forms Status Report
This report allows a teacher to view information related to Student Forms associated with students on their active rosters. It will display details of users and timestamps related to assigning the form to a student and the most recent update to the form.
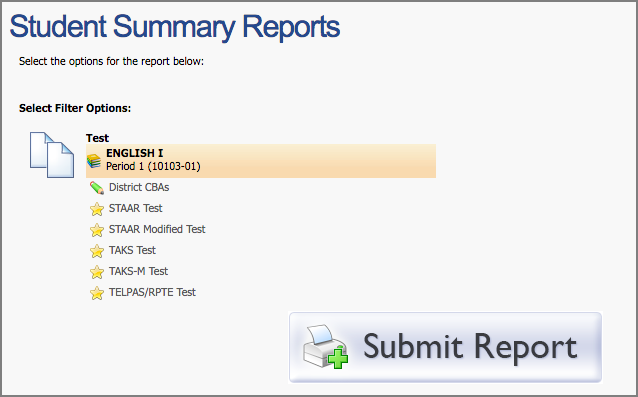
Student Test Summary Report
This report will mass-print the test summary for each student who has taken the chosen assessment. This report will be similar to the individual test summary seen on the Test and Scores tab in the student profile.
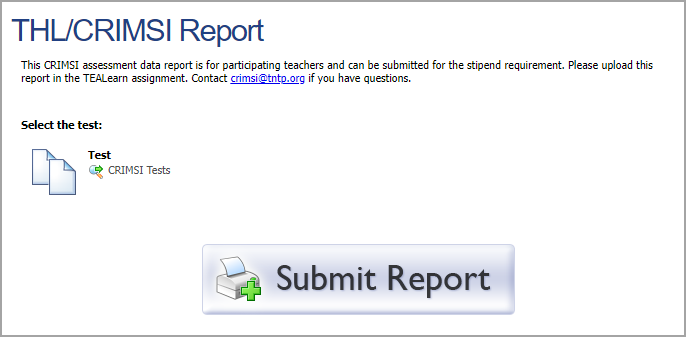
THL/CRIMSI Report
This report allows any teacher in an organization with the CRIMSI license enabled to use a pre-built data report. The data provided in the report will easily generate the standard file the districts can provide to the TEA THL/CRIMSI team.
Reports for Teachers and Administrators
Student Constructed Response Tool
This tool allows teachers and administrators to search through and print students’ constructed responses, even after the testing window has closed. Responses are collected through both online testing and scanned documents. If a test has no constructed response question types, the report will not run, and users will see a pop-up notifying them of the problem. Teachers choose between consolidated (grouped by question) or detailed (grouped by student) views.
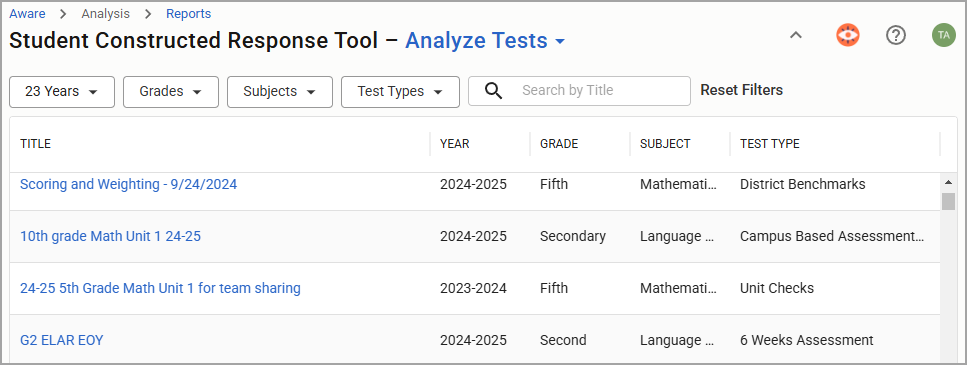
Select a test using the assessment table. You can use the top drop-down menu to search by rights (if available), all my students, or class period. Additional filters can be used to find specific tests.
Years
Grades
Subjects
Test Types
Search by Title
Any test that does not include a constructed response question is automatically filtered out and will not appear in the table. You can open assessments to assign scores to student responses.

After selecting a test, the user can apply various filters to narrow down the desired set of constructed responses.
Filters for teachers:
Groups: Change class periods or group multiple class periods together.
Scores: Select a single score or a range of scores to display.
Questions: Select one or multiple questions if more than one exists on the test.
Teachers: Teacher names are only visible if a student takes an assessment while rostered to another teacher.
Search box: Search by student name or keywords in the responses.
Note: Teachers may see a teacher column and filter if students took an assessment while rostered with another teacher.
Filters for administrators:
Testing schools (if more than one school is available)
Testing teachers
Scores
Questions
Users can print the selections made for the report by choosing either Print Consolidated Report, Print Detailed Report, or Export CSV.
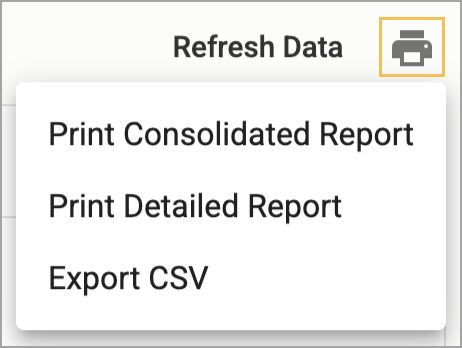
The consolidated report shows the question prompt and scoring guide once at the top, with student responses listed after. The detailed report shows the prompt, scoring guide, and student response for every student, with a page break between each student.
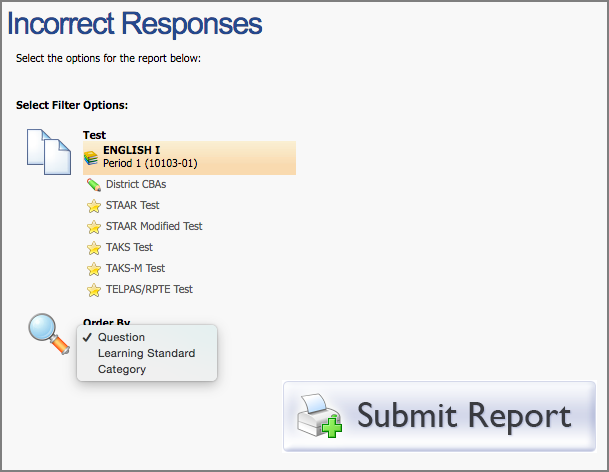
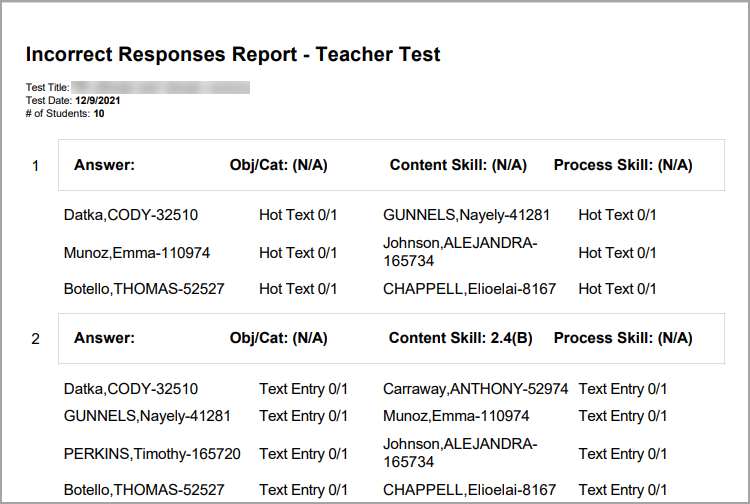
Incorrect Responses Report
This report will help you group students based on their responses to specific questions. Students who missed a certain question will be grouped by the desired parameter. Any incorrect interactive response questions will also be listed by type (hot spot, text entry, etc.). For district-level users, this report can be filtered down from the district to the school or teacher level. 