Any data view in Aware can be edited so districts have the ability to customize the information to meet their needs. Once new views are created, they can be saved and the templates can be shared with other district personnel. Saving and sharing templates is discussed in Saving Data Views.
Create a new data view or choose a test from Quick Views.
Click the Edit button.
Tests tab – allows you to change or add tests to view and summarize multiple tests you are viewing
Columns tab – allows you to select information for a view
Summarize tab – allows you to summarize information by rows. The Summarize tab is most often needed when summarizing district, campus, or teacher summary views. You can also summarize data within a subpopulation on the Summarize tab.
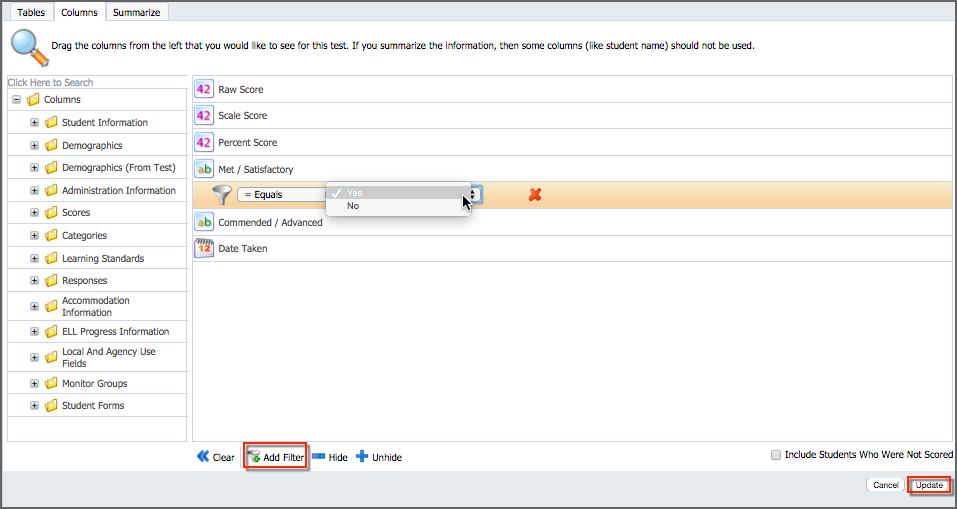
Tip: To get unscored students for imported assessment data like STAAR, edit a data view and go to the Columns tab. Open the Administration Information folder and drag Score Code into the view. Select Score Code and add the Doesn’t Equal Score filter. Finally, check the box at the bottom right corner for Include Students Who Were Not Scored and select Update to see those students.
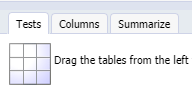
Tests Tab
The Tests tab will display the test that is currently being viewed. All other tests for the district are located in the folders and can be added to enable multi-test analysis and viewing.
The test currently being viewed will be on the right.
To add or choose another test:
Click on the Plus sign next to the test type.
Select the test.
Drag and drop it to the right.
To remove a test, click and drag it to the left.
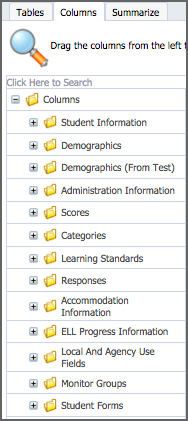
Columns Tab
The Columns tab contains the actual test information that can be viewed.
Click the Plus sign next to a folder to display the information options available.
Click the desired column heading from the list and drag it over to the right. To remove a column, drag it back over to the left.
Note: These will be the column headings in the view and the information requested will be displayed below the column heading in a table format.
To filter a column:
Click the column name (It will change to bold text.).
Click the Add Filter icon.
Information can be viewed within subgroups when more specific data is needed.
Choose/enter filtering criteria.
Click Update.
Note: To hide the column so that it does not appear on the view, but still filters, select the column heading and click Hide.
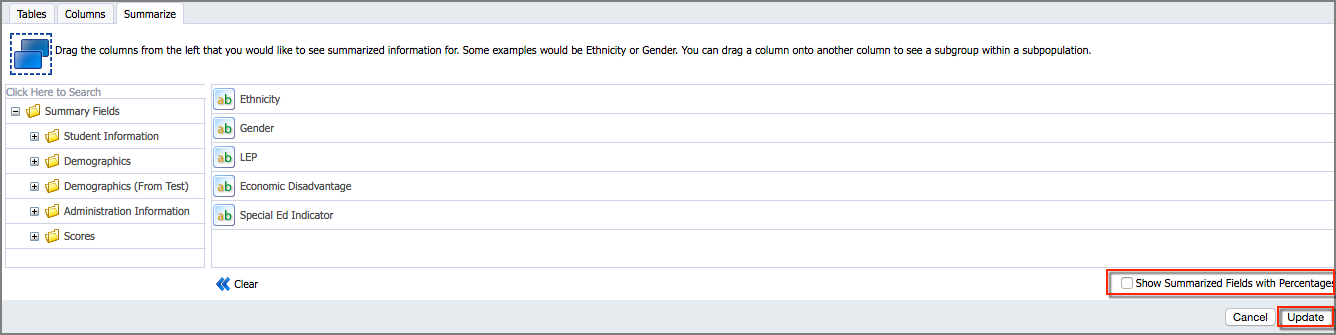
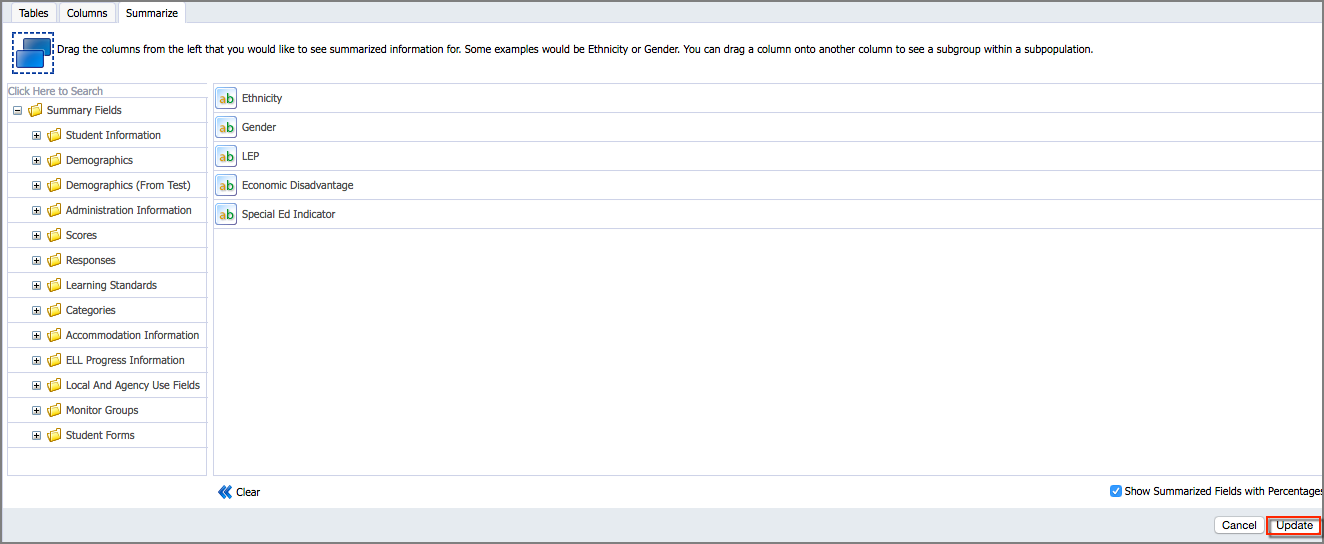
Summarize Tab
The Summarize tab provides different ways to summarize data for information selected on the Columns tab. The data will typically appear as a row. On the Summarize tab, click the Plus sign next to a folder to expand the available options and drag information over to the right. Information will be displayed in rows.
Note: Removing the check from the checkbox at the bottom right-hand side of the Summarize tab allows you to change fields that are displayed as a percentage to show as a ratio of number correct over number total. For example, if a percent on a particular learning standard was shown as 80%, you could uncheck this box and then update and the field would display as 4/5 or 8/10.
Click Update.
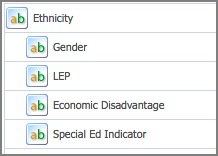
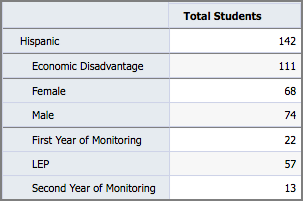
Viewing a Subgroup Within a Subpopulation
Information can be viewed within subgroups when more specific data is needed.
On the Summarize tab, drag the subgroup onto the subpopulation to see the information for the subpopulation summarized by specific subgroups. For example, to see the gender, LEP, and economic disadvantaged information for each ethnicity, drag the subpopulations onto ethnicity.
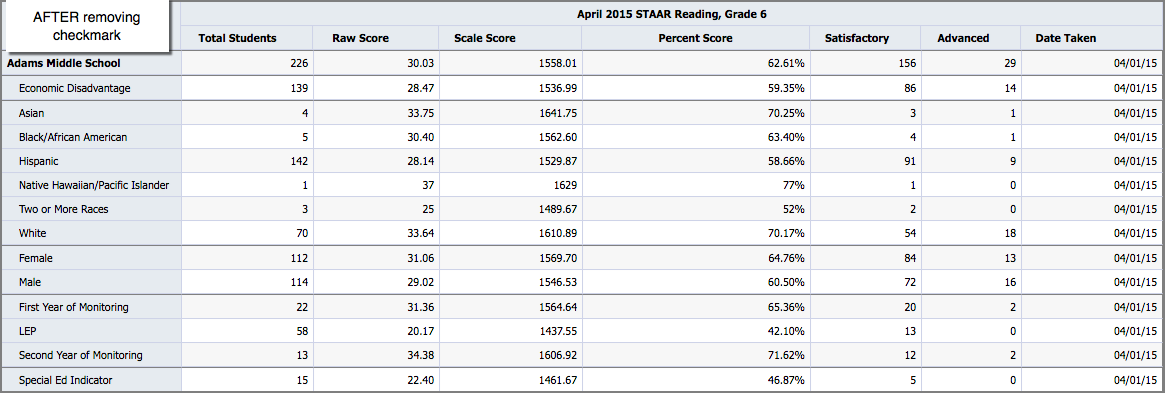
Viewing Summarized Fields as Numbers Instead of Percentages
By default, summarized information will be displayed as a percentage. Aware also allows the information to be viewed as numbers.
On the Summarize tab, remove the check mark from Show Summarized Fields with Percentages.
Click Update.