
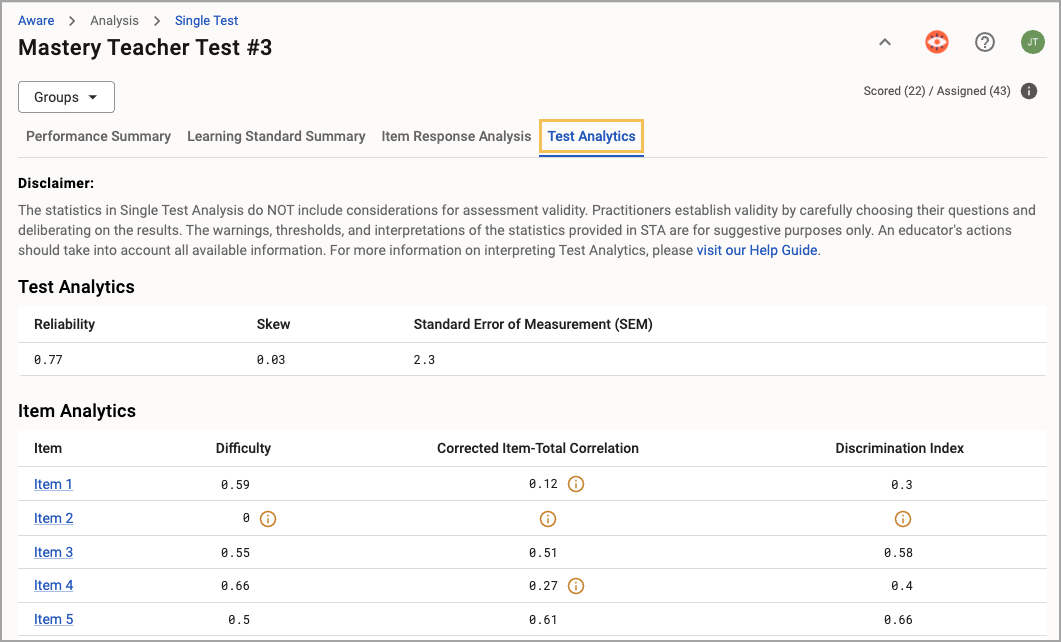
The Test Analytics tab in Single Test Analysis (STA) offers statistical analysis metrics on an assessment. These metrics provide users with additional insight into the validity and reliability of the assessment. While this is beneficial for improving a test’s overall health, it can be especially helpful for evaluating tests used for student growth measures.
To learn more about how Single Test Analysis performs calculations for the Test Analytics tab, review Test Analytics Calculations.
Setting User Security to Access Test Analytics
Some assessment scenarios may require a school district to control who can see Test Analytics. Users with the Create Local Assessment Tests right can configure access to Test Analytics by selecting Configure Test Types under the Assessment Settings gear. You can control security access for each individual test type using the following options:
Available for Teacher viewing
Available for School admin viewing
Available for District admin viewing
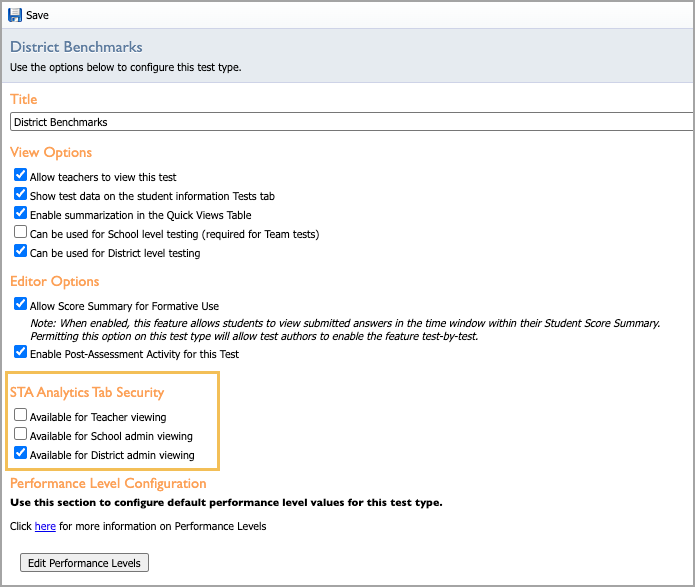
Each option controls whether or not each type of user can see the Test Analytics tab for that test type. Each test type must be set individually. All test types default to Available for District admin viewing and are unavailable for teacher or school admin users. To allow all users to access, check all boxes. To block access to the tab entirely, uncheck all boxes.
If you don’t check a setting under STA Analytics Tab Security, users in unchecked groups do not see the Test Analytics tab in the STA user interface.
In this case, school and district administrators are defined as using the Analyze Test right at either the school or district level. Teacher-level users are those with rostered courses or approved student access lists.
Note: STA Analytics Tab Security isn’t available for users with only the Analyze Subject and Analyze Grade rights unless you check all three boxes. If the user has anything else, such as a roster or Analyze Test, the user will still see the Test Analytics tab according to that level.
The teacher test type will not have the ability to view analytics enabled by default. A district administrator can turn that on for teacher tests under Configure Test Types.
Interpreting Test Analytics
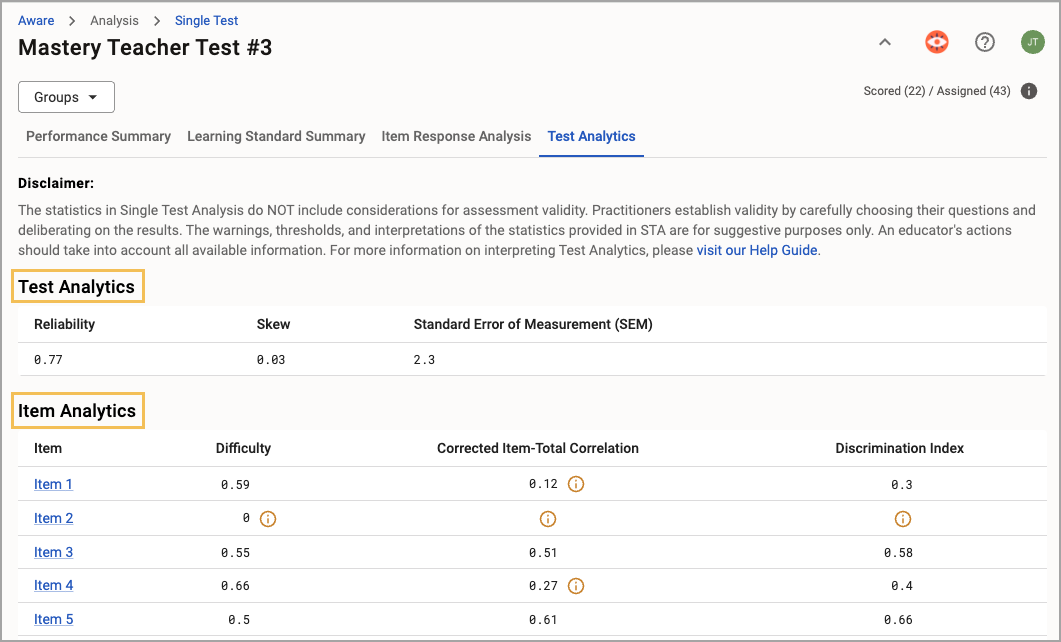
The Test Analytics tab splits results into two sections: Test Analytics and Item Analytics.
Note: Any chosen filters don’t affect the calculations made in STA’s Test Analytics. The system uses every student’s test result to calculate the various metrics to improve the validity of the results. Every user will see the same analytics for the chosen assessment.
Test Analytics
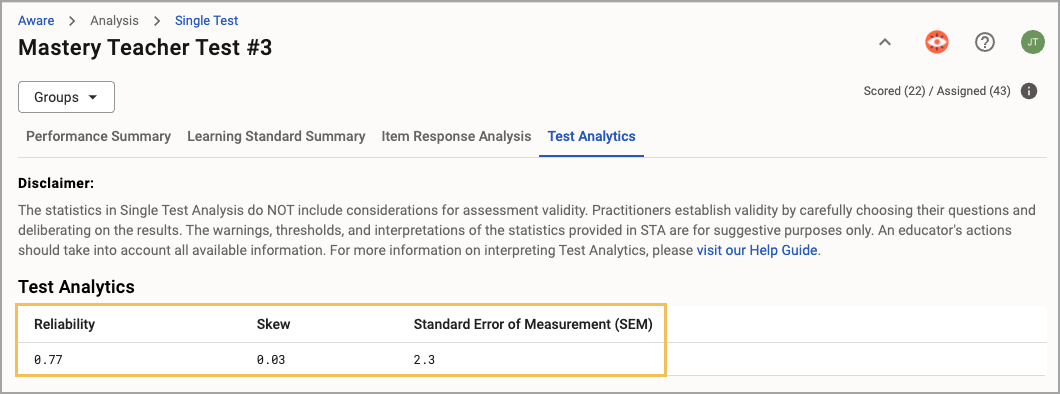
Single Test Analysis calculates the first set of statistics at the test level with every student and every item. The values under Test Analytics provide some insight into the assessment’s overall health.
The statistics for Test Analytics include the following options:
Reliability - Assesses the consistency of the test, indicating how dependable the results are, with higher reliability meaning that the test produces stable and repeatable scores
Skew - Measures the asymmetry of score distribution, in which positive skew means more students scored low and negative skew means more students scored high
Standard Error of Measurement (SEM) - Indicates the range of error in a student’s score due to imperfect test reliability, in which a smaller SEM means more precise scores
Hovering over the name of each statistic provides a brief description of what it measures.
When calculations cross certain thresholds, warnings will appear with a yellow Warning icon. Hover over the icon to see a message providing additional information about why the system generated a warning. These warnings can provide users with enough information to explore potential revisions to improve the assessment’s overall health.
Caution: Assessments with fewer than 100 test entries may have results that are not considered statistically significant.
Item Analytics
Single Test Analysis calculates the second set of statistics at the item level across all students who took the assessment. These values under Item Analytics provide information about each item’s overall health.
The statistics for Item Analytics include the following options:
Difficulty - Measures how easy or hard a test item is based on the proportion of students who answered it correctly, in which a higher value indicates the item is easier
Corrected Item-Total Correlation - Evaluates how well an individual test item correlates with the total score, excluding itself, and shows whether the item is consistent with the overall test
Discrimination Index - Indicates how well a test item differentiates between high-performing and low-performing students, in which higher values indicate better discrimination
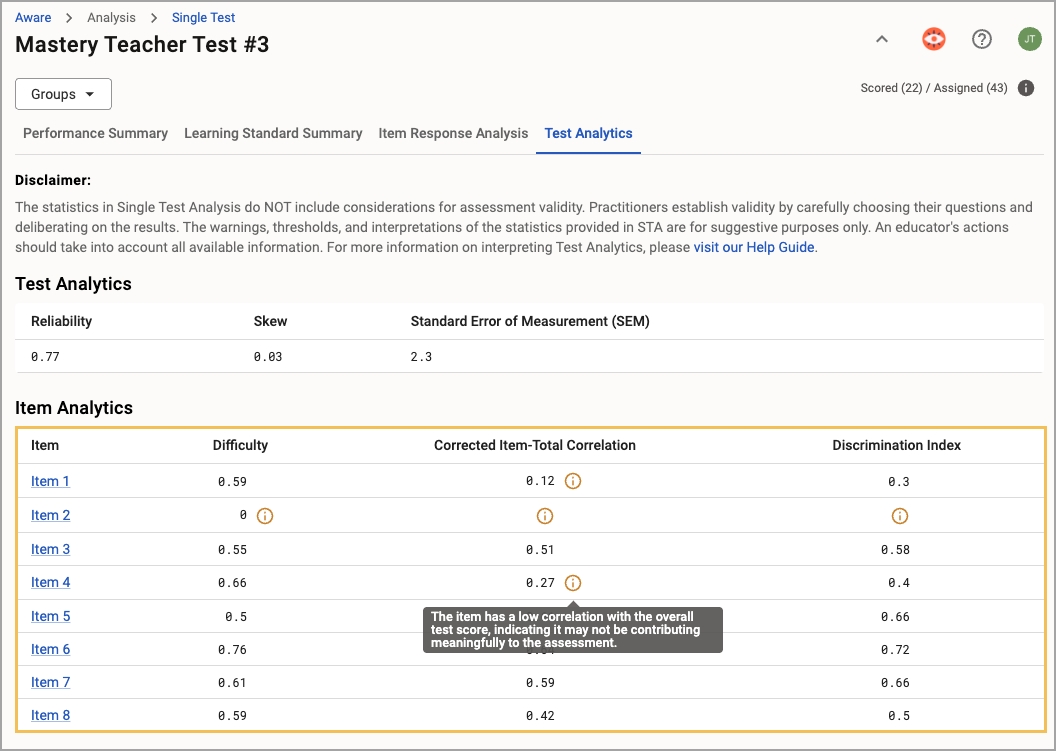
Click on the item to open the Item Response Analysis tab in Single Test Analysis, where you can review the item’s details, answer distribution, and student responses.
To learn more about how Single Test Analysis performs calculations for the Test Analytics tab, review Test Analytics Calculations.