Principals and District Data Viewers are able to generate the Threshold Analysis report in Aware. This report can be built using STAAR or Local Assessment data.
The Threshold Analysis report will display summary results for the percentage of scores at and above seven possible cut points, or thresholds. There is also a feature in Aware that allows Threshold Analysis reports to be generated at the student level.
Access
Principals can see individual student data and campus-wide summary data. They can filter views to specific teachers and course sections/periods.
District Data Viewers can see individual student and district-wide summary data. They can filter data to a single campus as well as specific teachers or course sections/periods.
Note: lead4ward Helpguides for the Threshold Analysis report are available and can be downloaded by clicking the link at the bottom of this page.
Creating Your Threshold Analysis Report
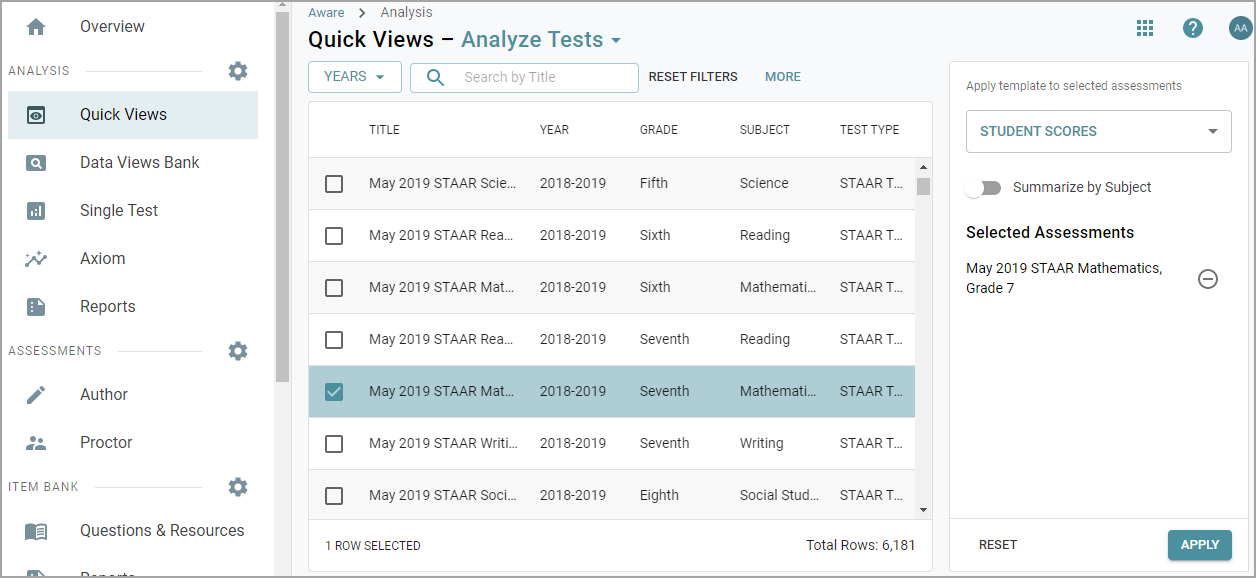
Step 1: Choose any STAAR or local assessment under Quick Views in Aware.
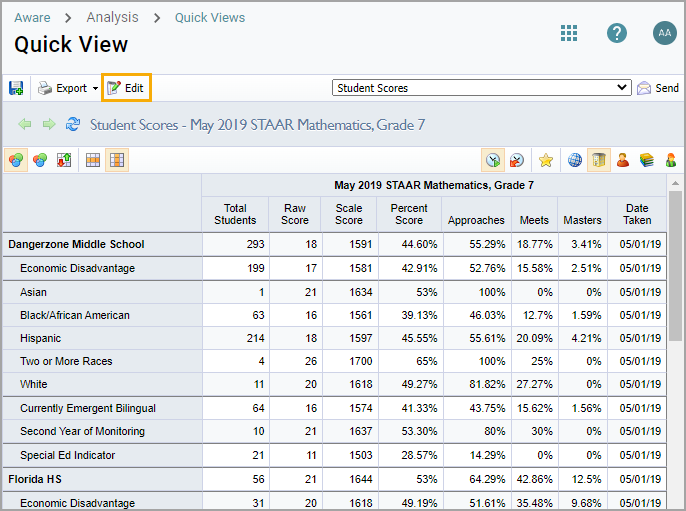
Step 2: While on the Student Scores view, click the Edit button.
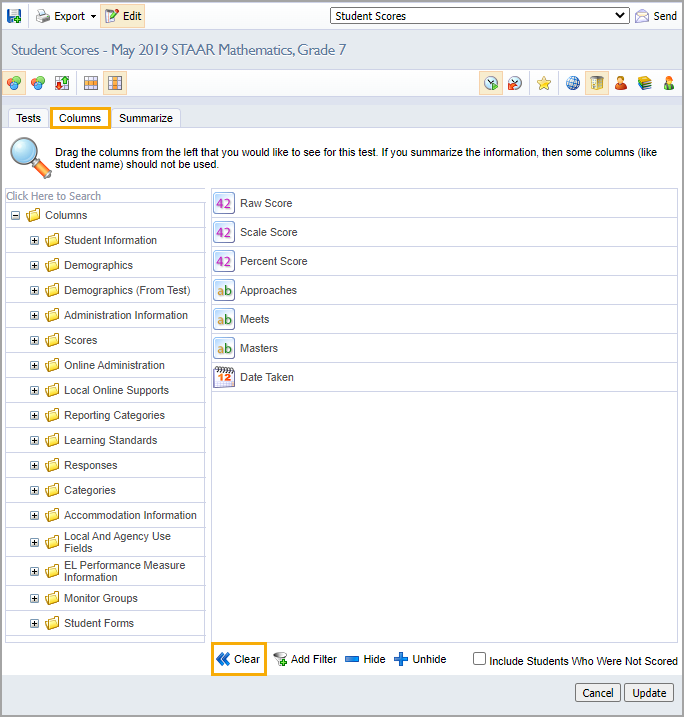
Step 3: Under the Columns tab, select Clear to remove all current fields.
Step 4: Open the Scores folder. Drag and drop the lead4ward - Threshold Analysis field over to the right. Click Update.
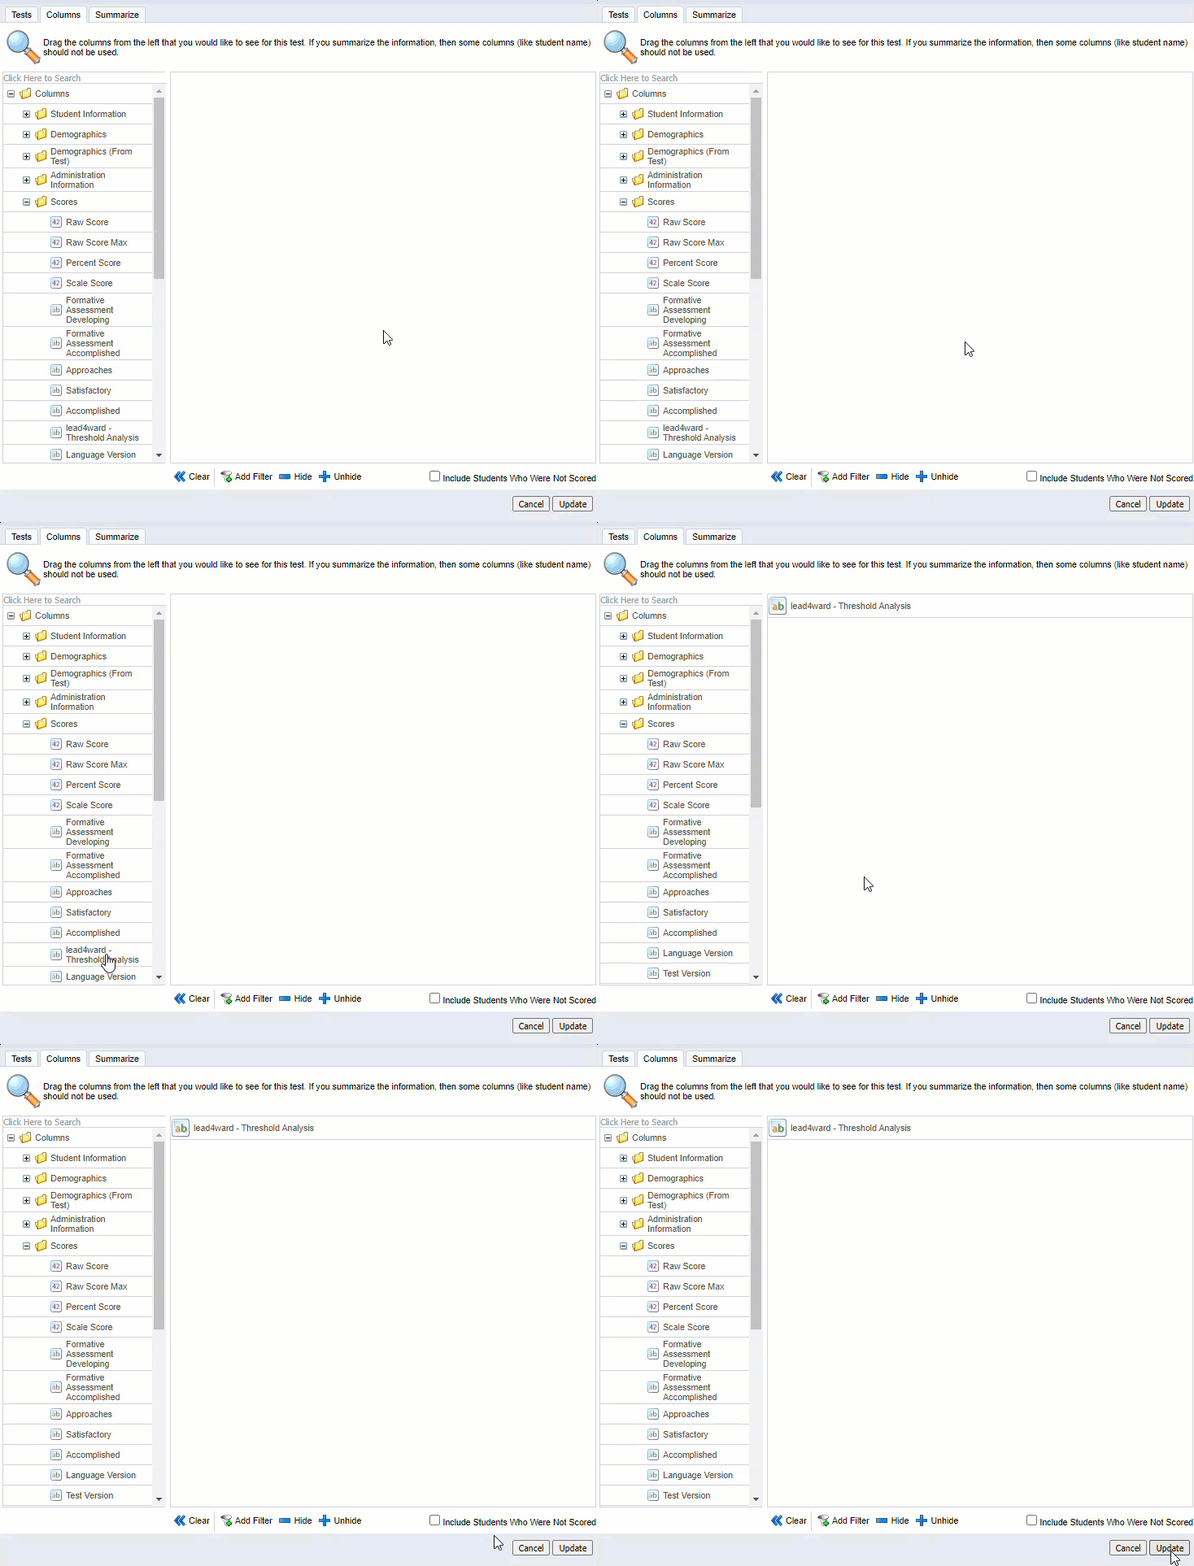
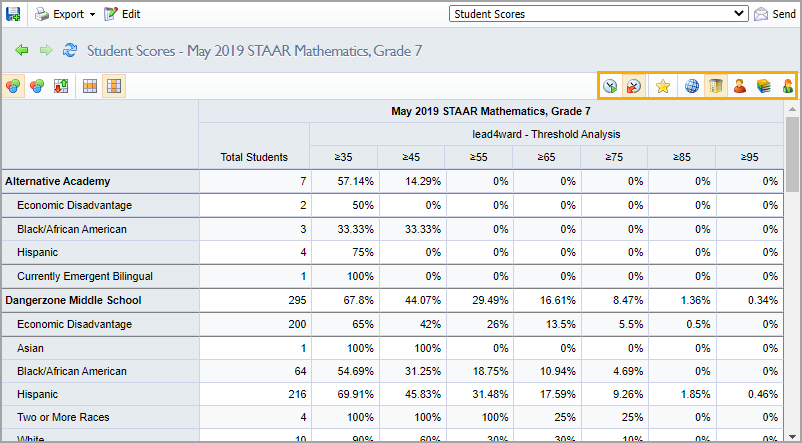
Step 5: Toggle through the icons to filter the view from district-level data down to individual student data.
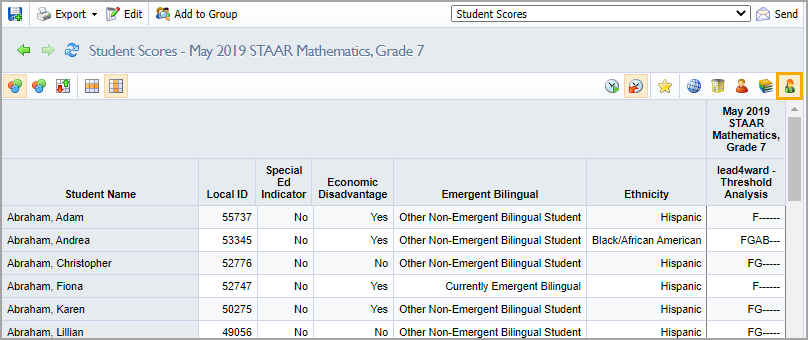
The Individual Student view generates a letter code for each student.
Each letter earned indicates a threshold that has been met:
No Letter = Below 35%
F = At or above 35%
FG = At or above 45%
FGA = At or above 55%
FGAB = At or above 65%
FGABC = At or Above 75%
FGABCD = At or above 85%
FGABCDE = At or above 95%
For information on using the Threshold Analysis report, please see the lead4ward Helpguides attached below, or contact wade@lead4ward.com.