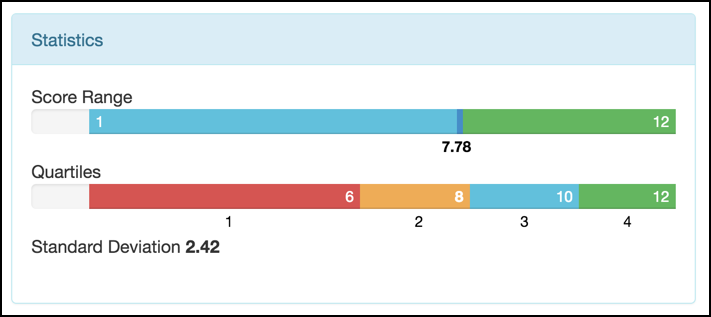
The Statistics section of the Aware Local Test Analytics tool contains basic descriptive statistics gathered from the scored test entries. These statistics relate specifically to the test’s score distributions and can be used for conversations about an assessment’s overall difficulty.

Score Range
This bar displays the highest and lowest (max and min) raw scores earned on the test. It also includes a bar representing the mean score of all test entries.
Score range information can be used in conversations about the overall difficulty of the assessment. How wide of a range is it? How far to the right of the bar (the higher-scoring end) does it go? How far to the right is the mean score? These questions are examples of discussion points for this information.
Quartiles
The quartile bar is similar to the score range in that it displays the max and min scores. The difference is that this bar is divided to represent 25%, 50%, 75%, and 100% of the test entries. The cut points in the quartile bar represent the raw scores at which these four groups of students fall.
The width of each quartile and the raw score cut points for each division can be used for a discussion of the distribution of the data.
Standard Deviation
Standard deviation is a number that represents the spread of a set of results as they relate to the mean (or average) score. A lower standard deviation (approaching 0) means the results are close to the mean score. A higher number means that results are spread out. Outliers are weighed more heavily and result in noticeably higher values.
A high standard deviation, especially when compared with conversations about the score range and the quartile cut points, can indicate a need to discuss potential error scores not associated with student learning.