The Item Statistics section of the Aware Local Test Analytics tool is the most informative section for discussing test performance. This section contains metrics for each individual item that can help identify potential errors in the test design itself.
Additionally, this section provides clues about potential issues with each item based on the metrics. The information provided can help the test author discuss interpretations of test items’ results or find reasons to alter or remove the items from future administrations of the same test. Each column is sortable except for the response columns.
It is important to note that a number from a statistical function calculated for an item does not supplant the importance of practitioner validity. Test authors choose or design items on an assessment with intent, informed by their expertise about the curriculum they’re measuring.
This practice embeds validity into the assessment creation. The conclusions the test authors seek to make about student learning drive their choices. Item statistics included in this tool are meant to supplement, not supplant, practitioner-embedded validity.
Note: Test Analytics does not calculate correct values for interactive item types.
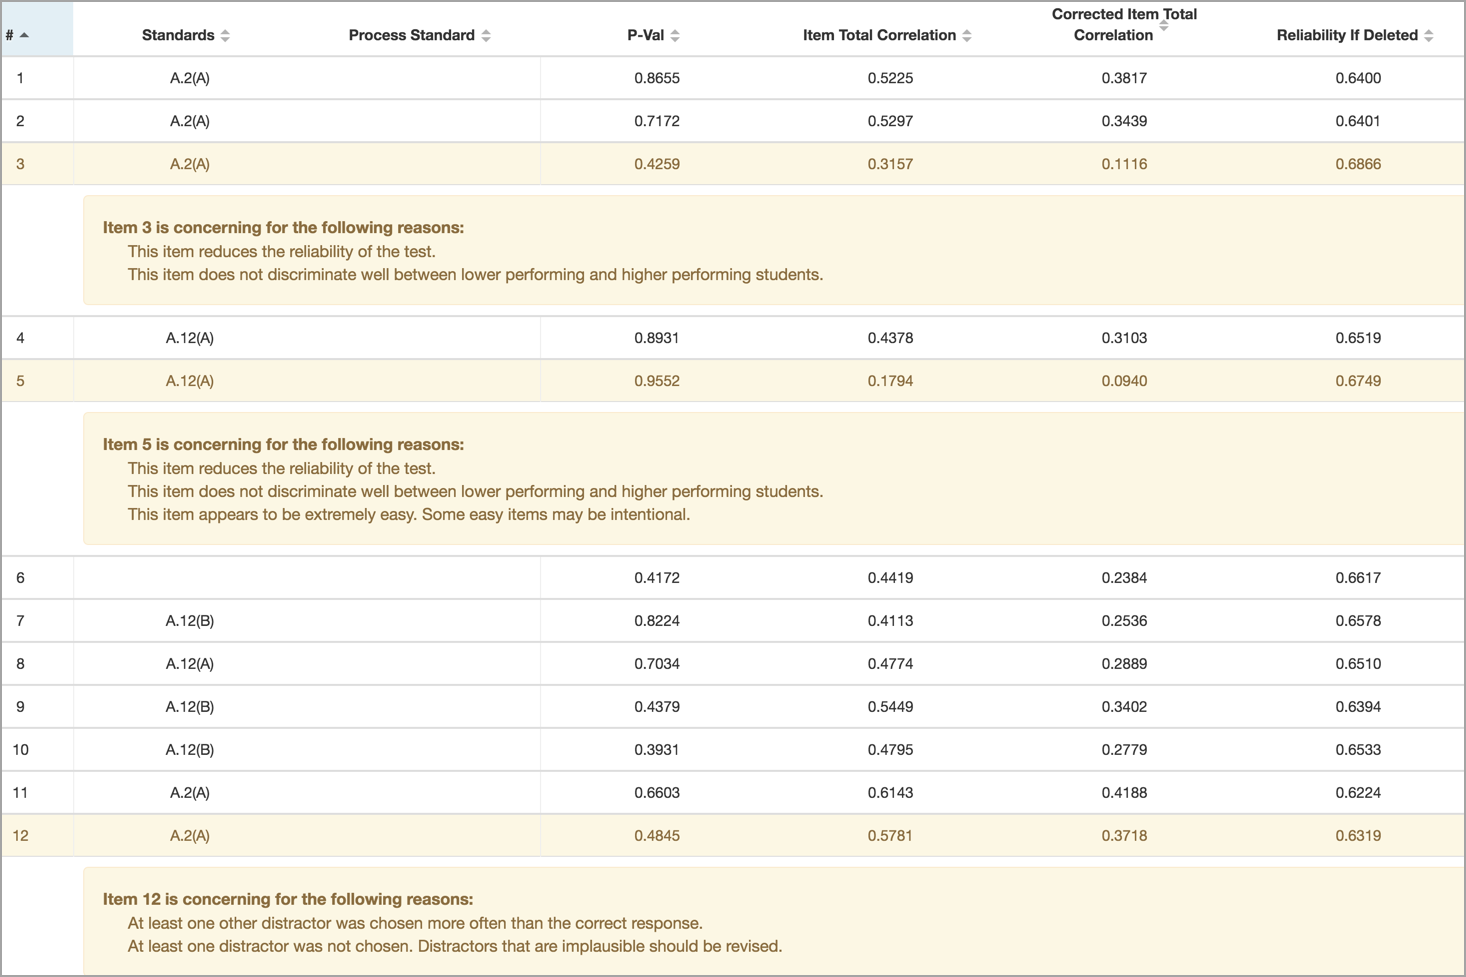
P-Value
P-value is the statistics term for Item Difficulty. On a local assessment, Item Difficulty is the proportion of students who got the answer correct. This definition is slightly modified for constructed response items graded on a rubric scale. Possible scores for p-value range from 0 to 1.
Since most, if not all, local assessments are criterion-referenced tests, the intent is for students to demonstrate learning by getting many items correct. For this reason, p-values should not be very low on many items. It is sometimes desired to have some more difficult items, as well as some less difficult ones. The Local Test Analytics tool will flag items with p-values > = 0.95 as “easy” and < = 0.15 as “hard.”
Item Total Correlation
The Item Total Correlation number represents the relationship between the item’s performance and the total performance on the assessment. It is often called “Item Discrimination” and uses a point-biserial function to be calculated. The concept is that an item’s performance should discriminate among students based on how well they each score on the whole test. A student with a high score should do well on the item, while a student who scores lower should be more likely to miss the item. Possible scores range from -1 to 1, but negative values are rare and suggest that an item may have a faulty key (high-scoring students missed it while low-scoring students did not).
Desired point-biserial values for a typical criterion-referenced test consisting of mostly multiple-choice items range from 0.2 to 0.39. While the formula allows values to approach 1, it is improbable that any item on an Aware local assessment will be that high.
Corrected Item Total Correlation
The Local Test Analytics tool will flag an item with a Corrected Item Total Correlation value lower than 0.15 (with special attention given to negative values). The Local Test Analytics tool provides a corrected correlation for item discrimination. This correction is often a preferred indication of this value because it relates the item’s performance to the test’s performance, excluding the item itself.
Reliability If Deleted
Will this test have a higher reliability coefficient if this item were not on it? A test author may consider removing an item from a future administration of a test if the item does not add to the overall reliability of the assessment.
Response Data
These results should match what users see in Aware when viewing data. They can lead to distractor analysis. Just as the correct answer should always be correct, each distractor should always be incorrect. Analyzing distractors can lead to pedagogical discussions about student learning but may also reveal weaknesses in the response options.