The Student Growth and Teacher Performance Correlation tool pulls teacher performance data from the selected observation or summative document and compares it with student growth scores from the Manage Student Growth feature. This allows districts to view and analyze the correlation between teacher performance and student growth.
Accessing the Student Growth and Teacher Performance Correlation Tool
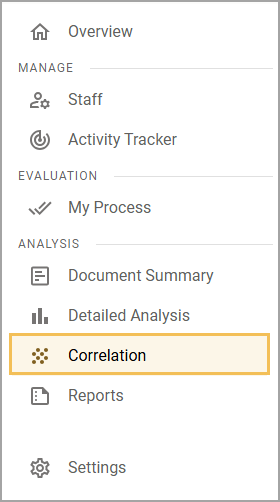
Step 1: Log in to Strive and select Correlation () under Analysis.
Step 2: Use the drop-down menus to adjust the filters as desired, then click Create.
Note: The summative or observation template you select must meet the following criteria:
The template must be connected to a framework.
The template must include matrix items.
All matrix items must be connected to the to the dimensions of a framework.
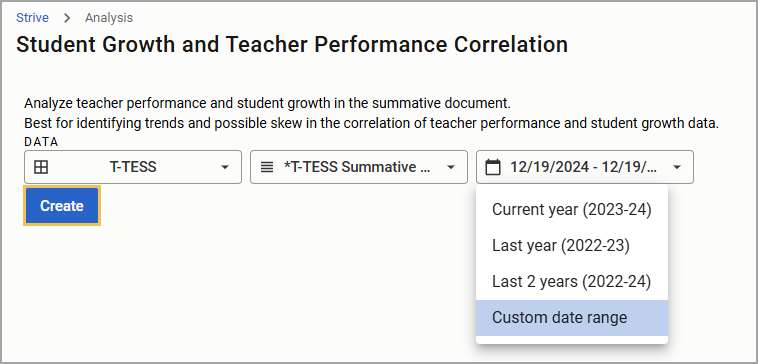
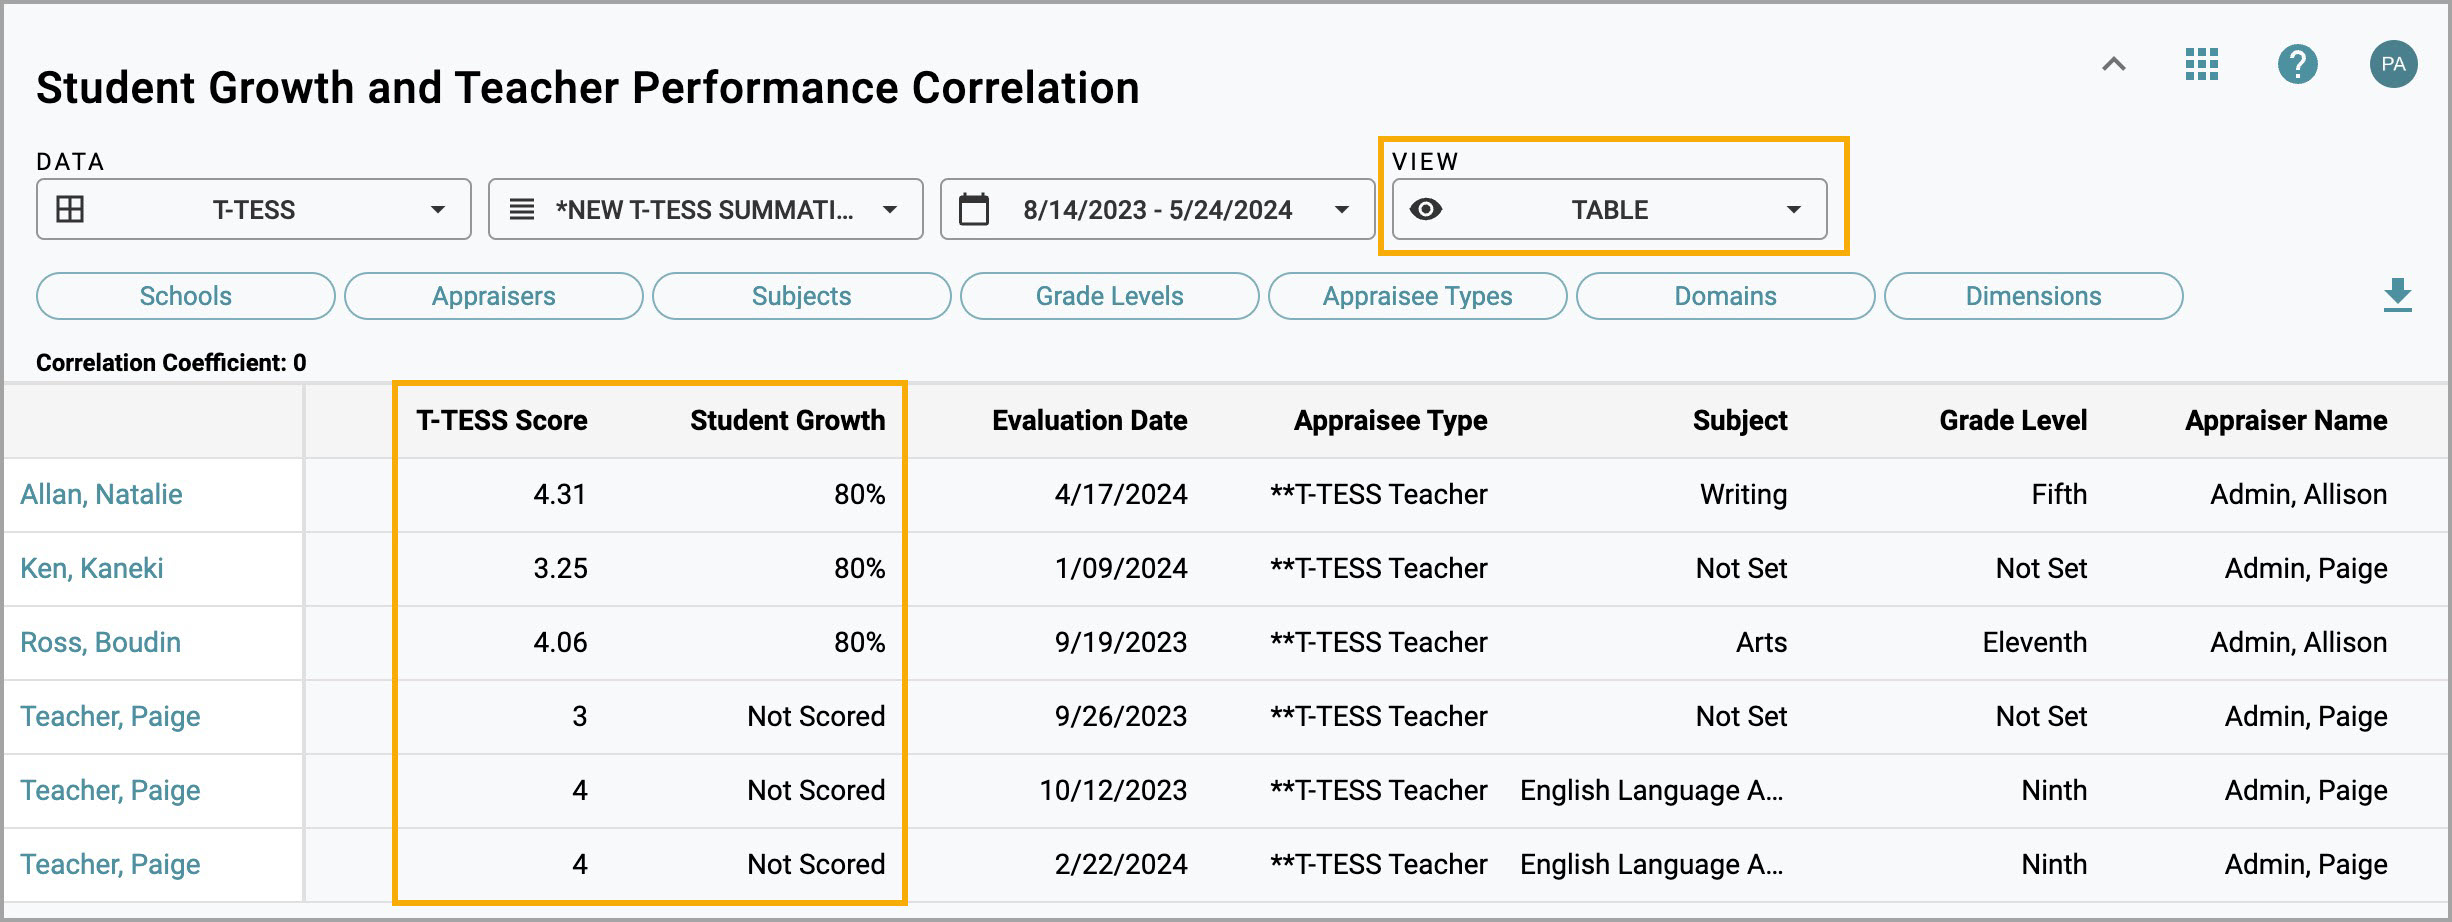
Table View
Select Table from the View drop-down menu to see T-TESS Scores and Student Growth percentages in columns.
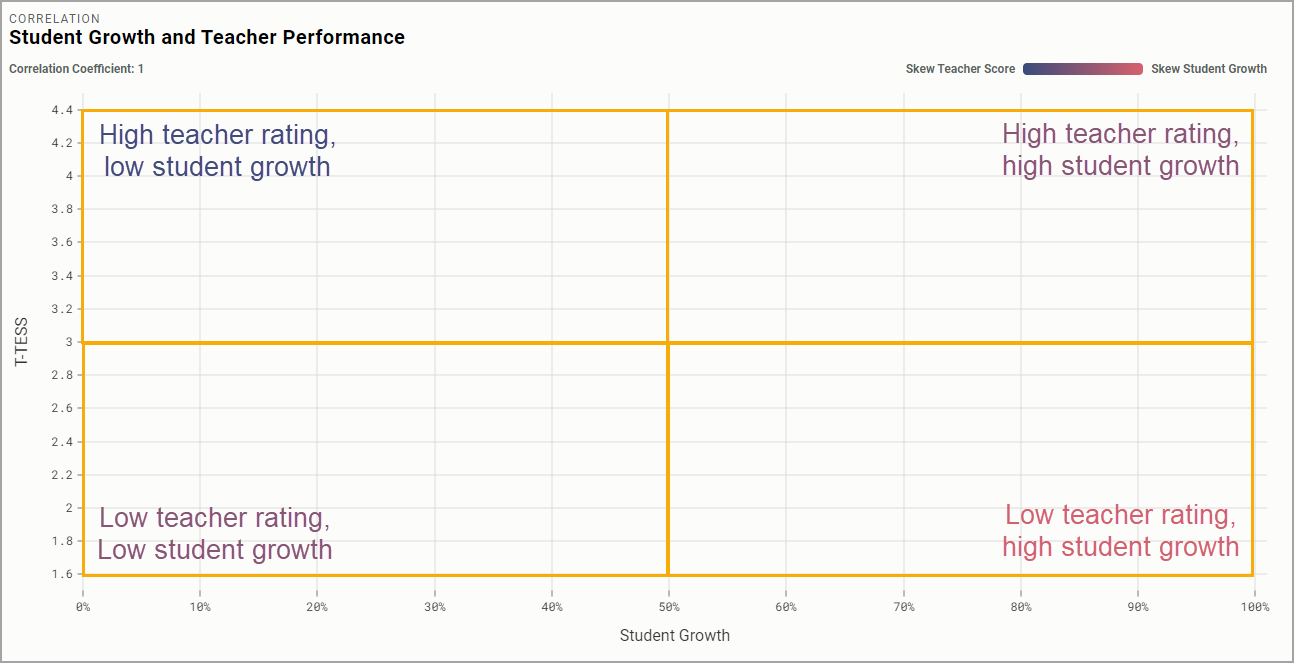
Scatter Plot View
Select Scatter Plot from the View drop-down menu to see a scatter plot graph of the correlation between the percentage of students meeting or exceeding growth and the teacher’s overall evaluation score.
.png)
Points on the scatter plot represent staff members. Each point is placed according to an staff member’s data collected in Strive.
Each section of the graph has different implications for measuring skew. Skew is identified by the color gradient above the graph.
Skew Teacher Score (darker blue) represents a high teacher rating but a low student growth score.
Skew Student Growth (lighter pink) represents a high student growth score but a low teacher rating.
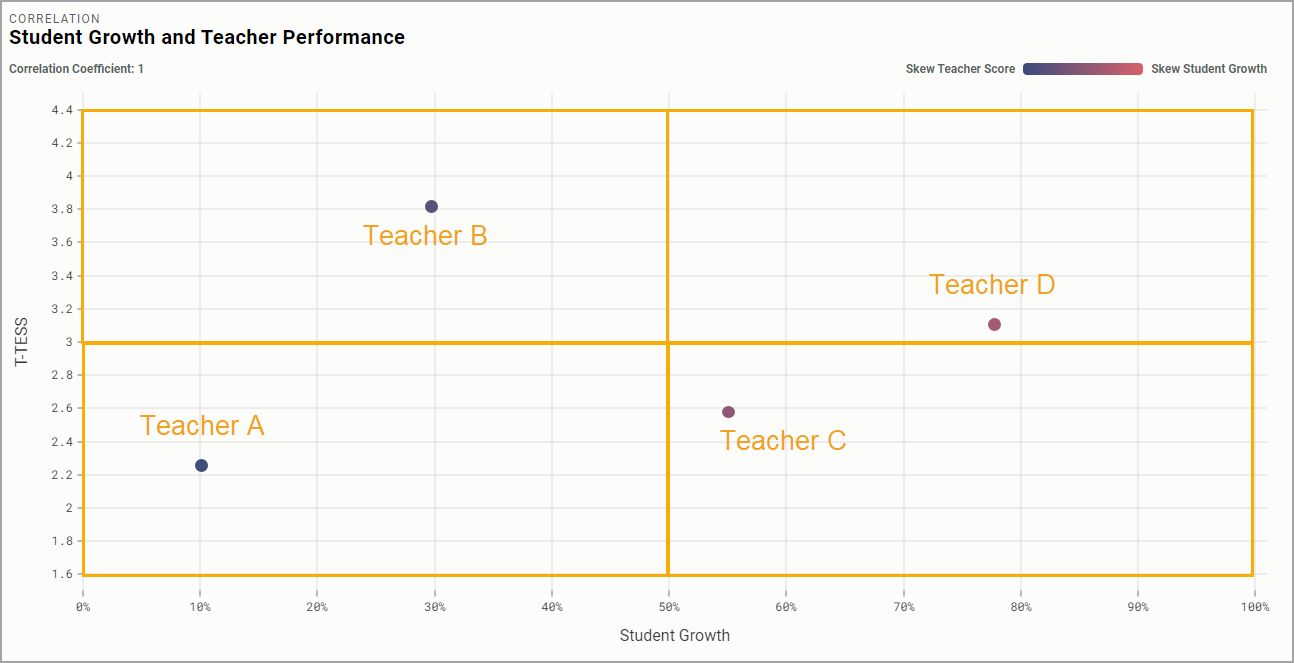
Teacher | Student Growth Scores | T-TESS Evaluation Score |
|---|---|---|
Teacher A | 10% of students met or exceeded growth | 2.2 |
Teacher B | 30% of students met or exceeded growth | 3.8 |
Teacher C | 55% of students met or exceeded growth | 2.55 |
Teacher D | 78% of students met or exceeded growth | 3.1 |
Caution: Skew graphs a corollary relationship between student growth scores and teacher evaluation scores. Evaluators and staff members should remember that correlation between data sets does not automatically equal causation. Many factors contribute to why a student growth score average may be low and a T-TESS score high, and vice versa. Data from the scatter plot, Teacher Evaluation Score panel, and Insight Cards provide educators with relevant information for further discussion.
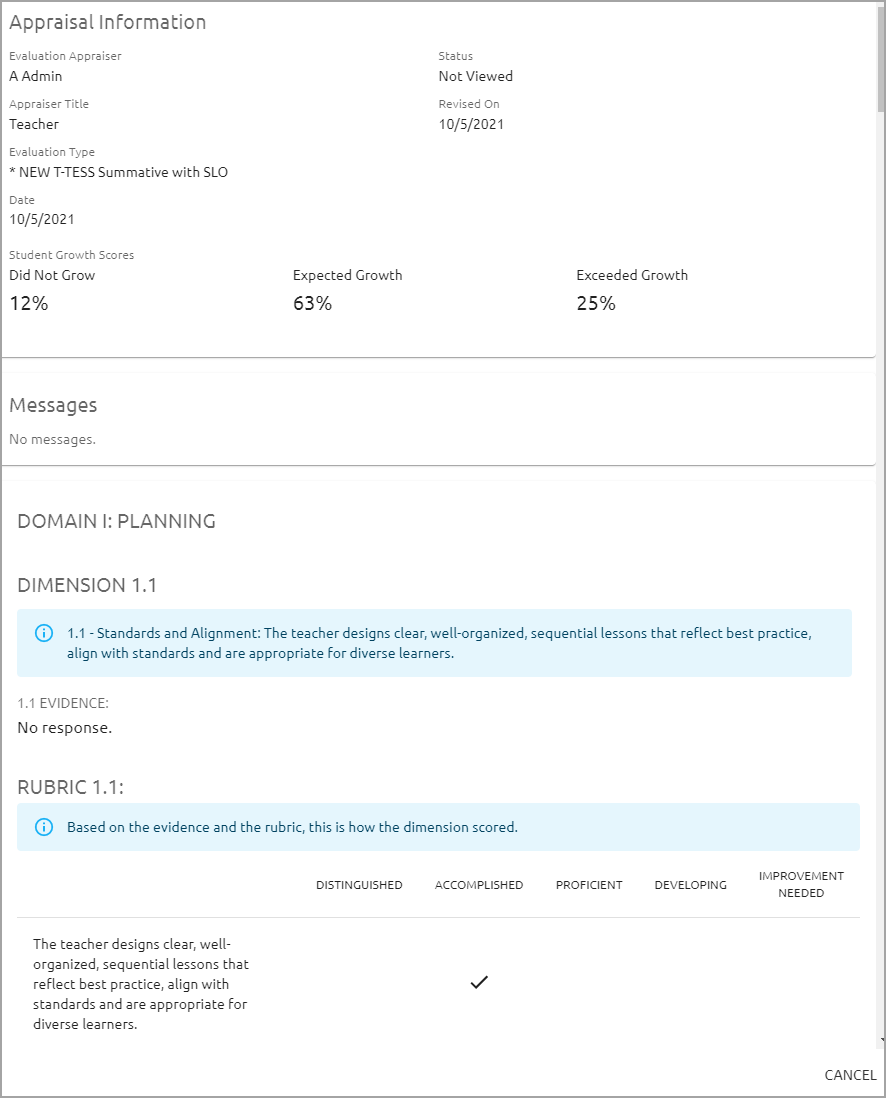
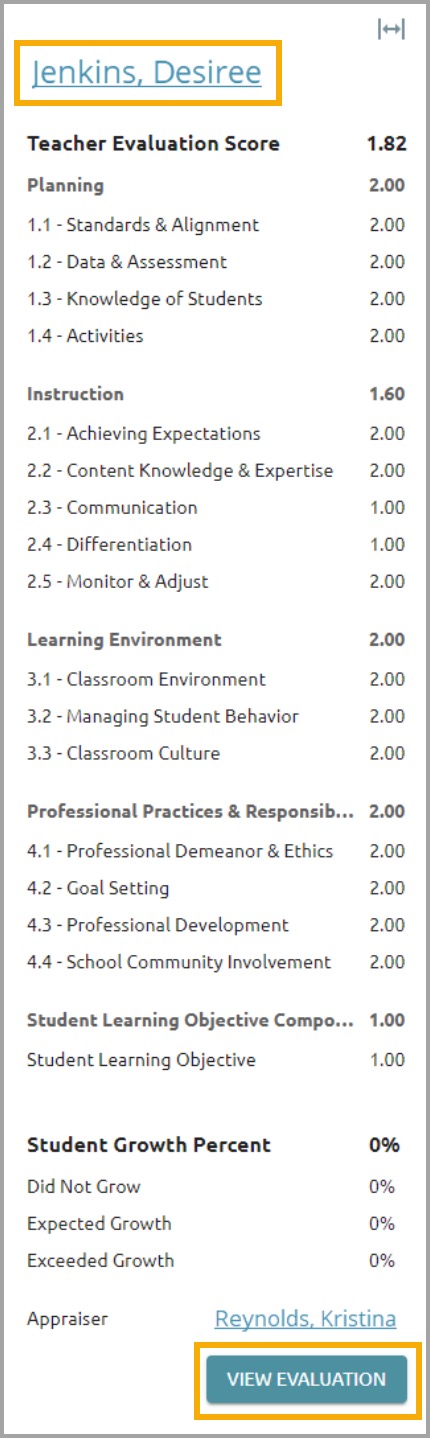
Select a point on the scatter plot graph to open that staff member’s Evaluation Score panel. This panel shows dimension ratings from the document. You can click on the teacher’s name at the top of the panel or the View Evaluation button at the bottom to see the full document, including evidence recorded and comments.
Insight Cards
Insight Cards show teachers with the highest teacher skew and student growth skew.
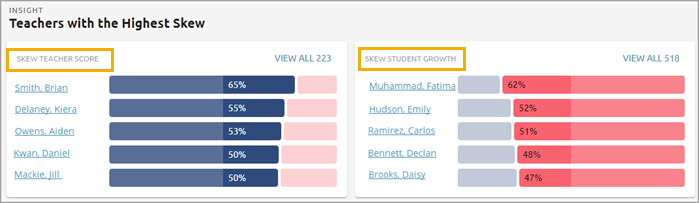
Select a name to open a preview panel containing evaluation information for that teacher