
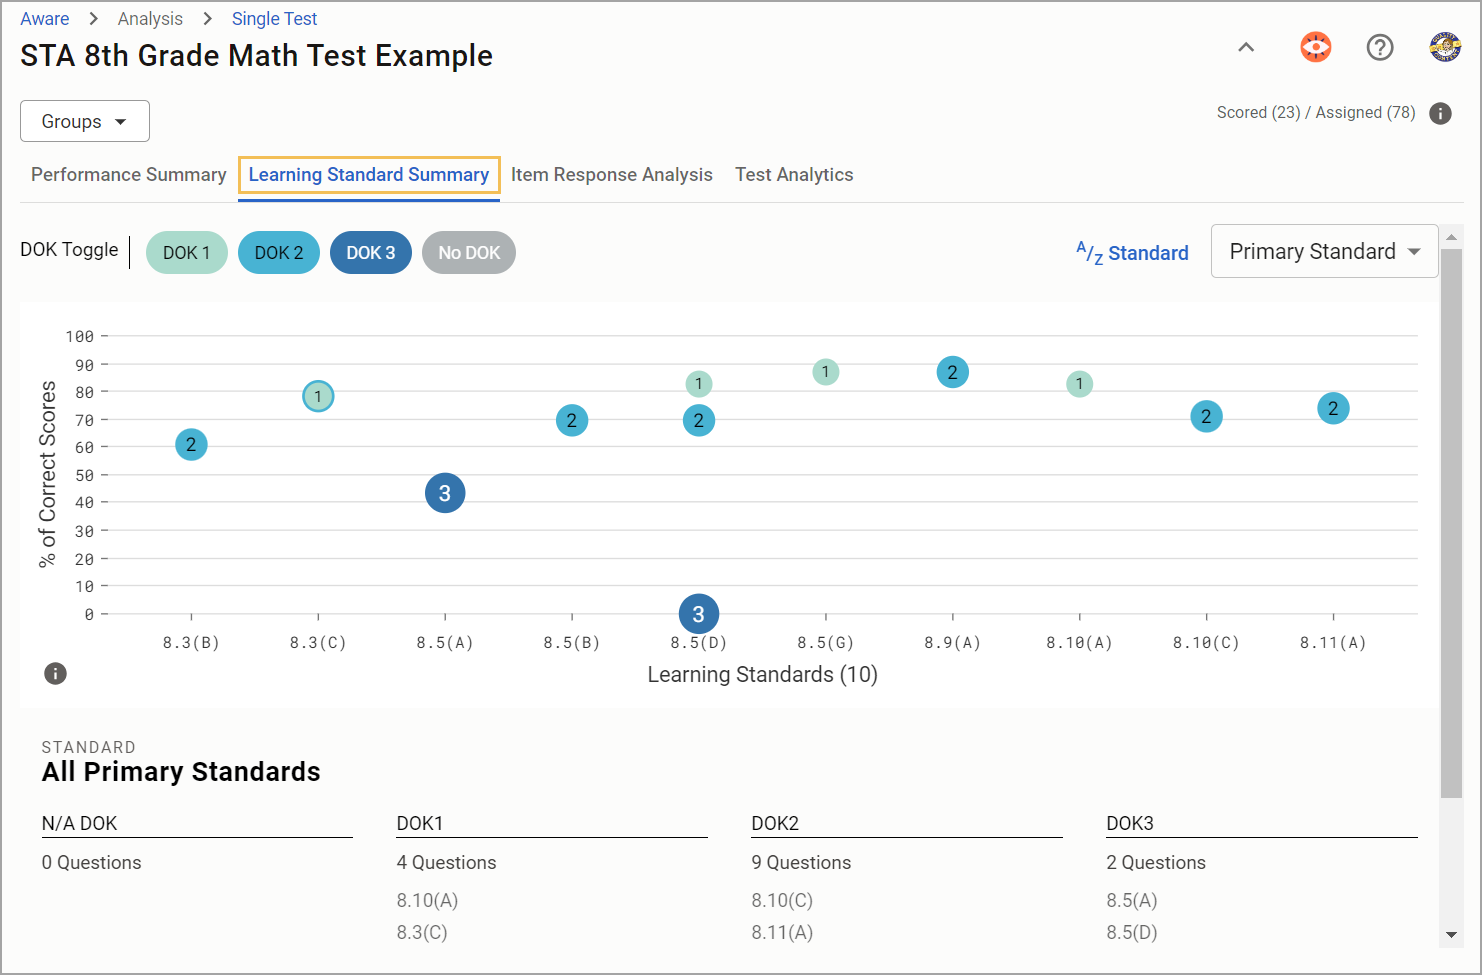
The Learning Standard Summary tab in Single Test Analysis displays the number of learning standards on an assessment compared to the average student percentage of correct scores. Teachers can draw further conclusions by examining the Depth of Knowledge level applied to the assessment questions.
Note: A correct score is defined as the student receiving the total possible points correct for each question. For example, students must earn 4/4 possible points for a constructed response question and 5/5 possible points for a Point per Task question.
Understanding the Learning Standard Summary
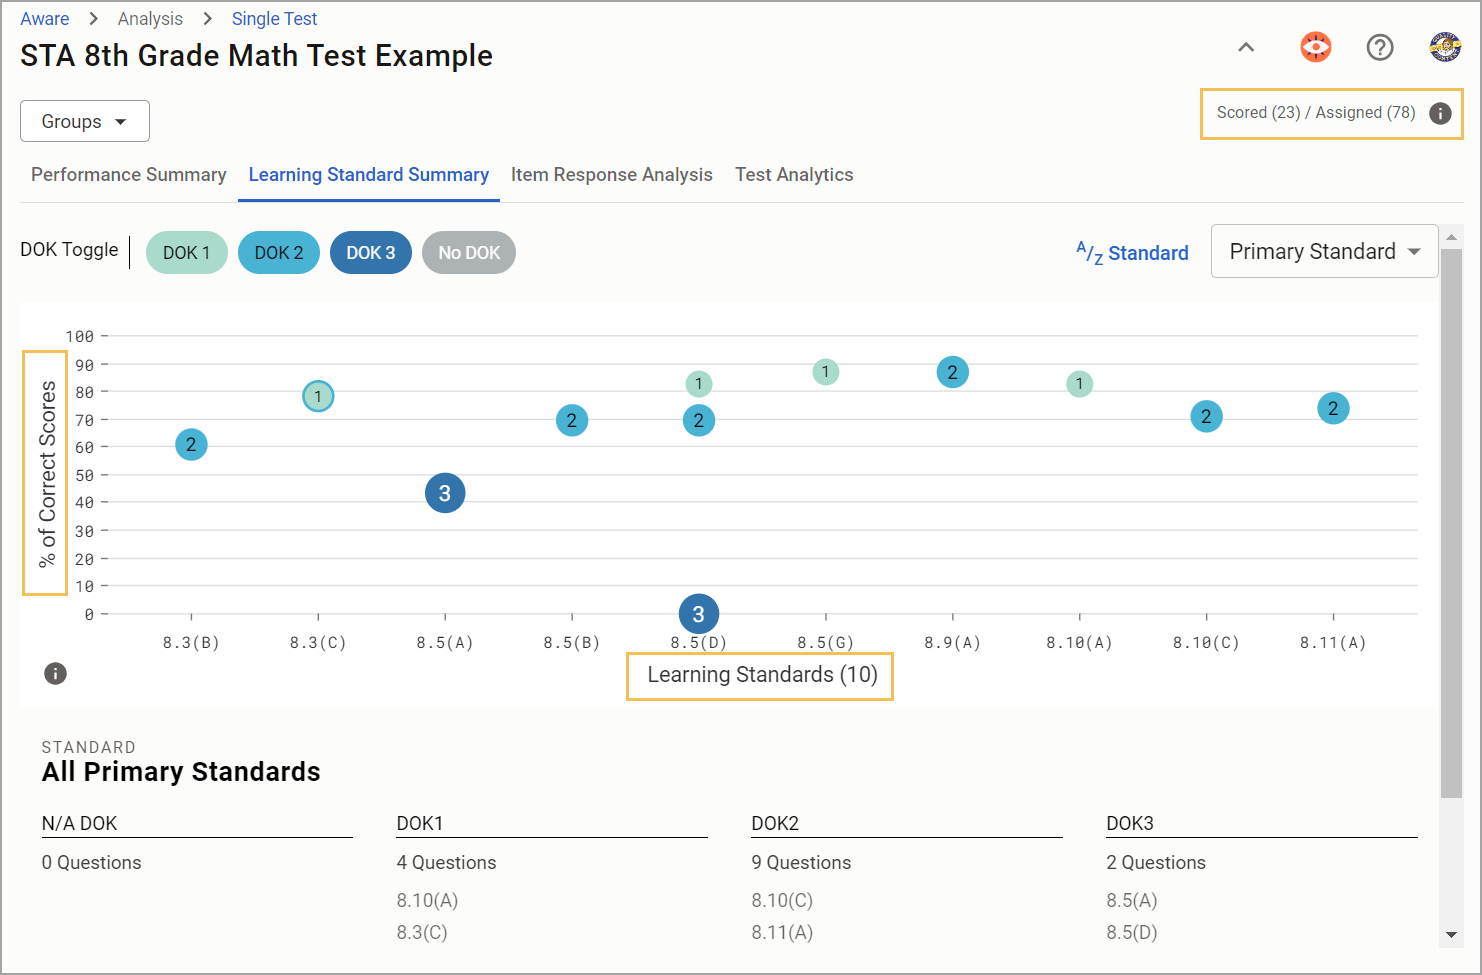
As you navigate the Learning Standard Summary, you will see the number of tests scored out of the number of tests assigned to students. These numbers are live and will change as more tests are scored. The dataset changes to reflect your drop-down menu selections if you choose multiple courses as a teacher or multiple schools and testing instructors as an administrator.
The Learning Standard Summary graph only shows the percentage of students that earned full credit. This may result in data that does not align with Quick Views.
Note: The analysis will not include data from students who have not yet taken the test or if there are unscored constructed response questions. Test results in Data Views will not match Single Test Analysis results until 100% of tests are scored.
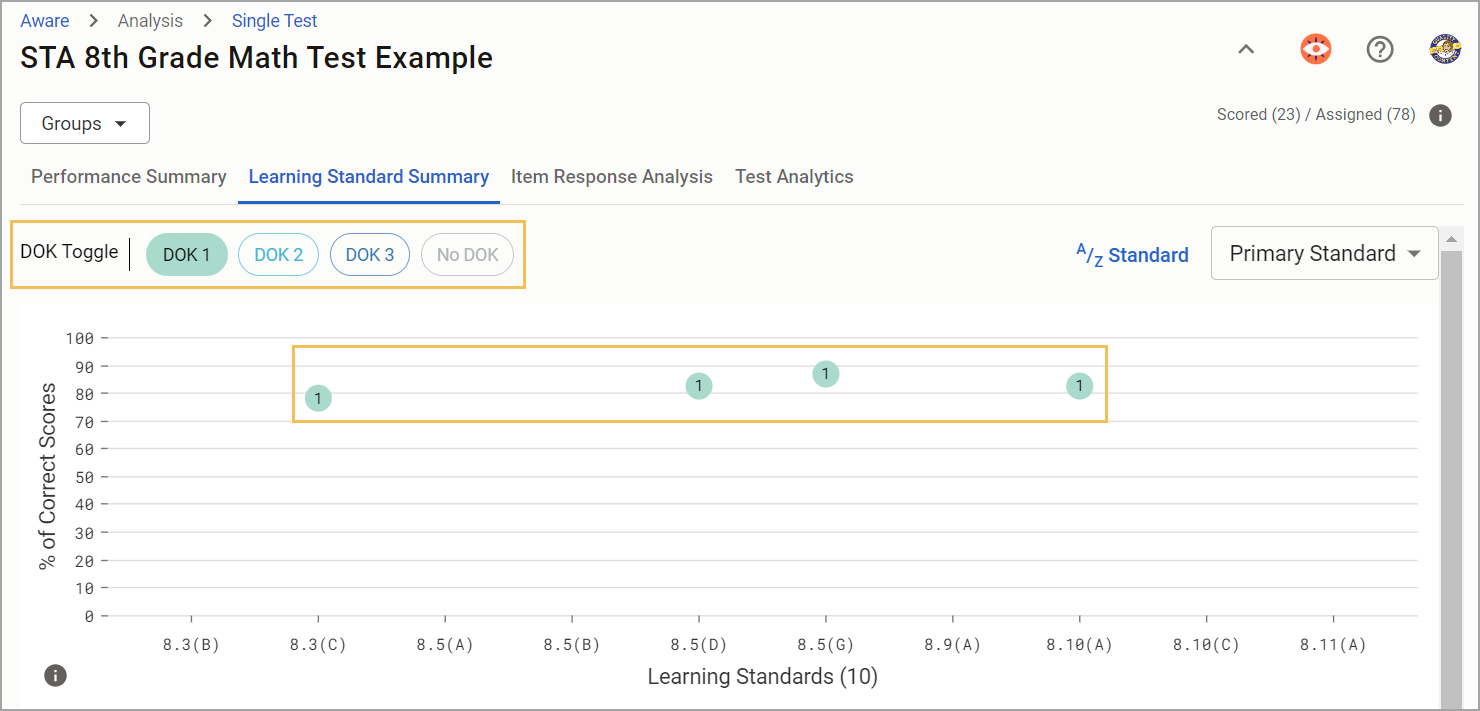
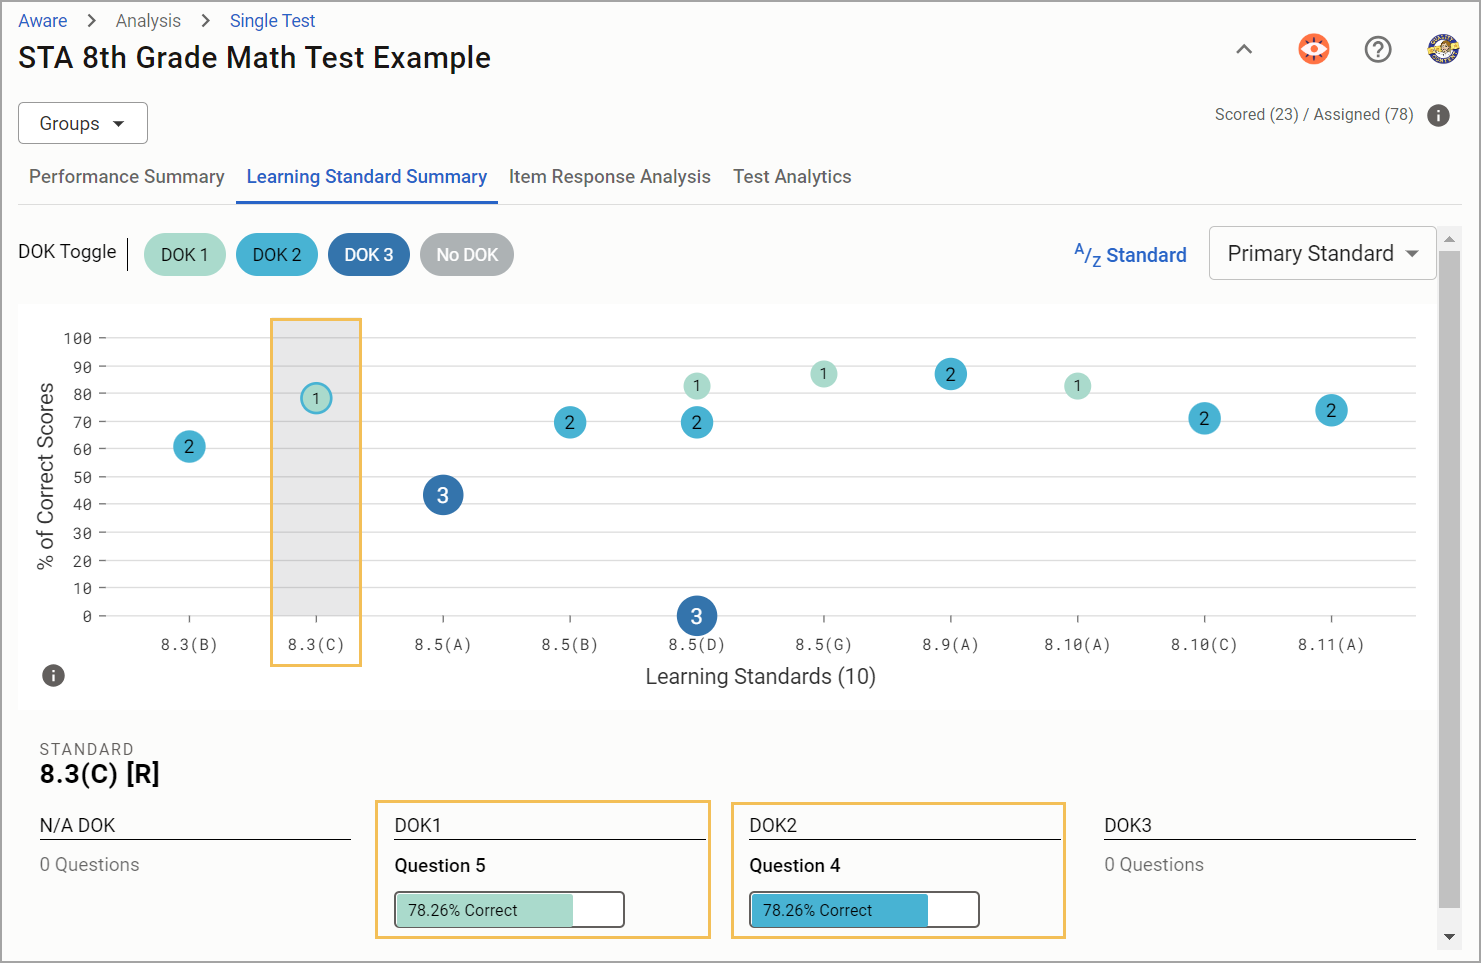
Step 1: Determine how you want to view the dataset with the DOK Toggle option.
The graph uses Depth of Knowledge as a filter while displaying the average percent of correct scores for each learning standard. By default, the graph shows all Depth of Knowledge levels:
DOK 1
DOK 2
DOK 3
No DOK
Click on any Depth of Knowledge level to remove it from the graph. For example, you may click DOK 2, DOK 3, and No DOK to display only the questions and learning standards assigned DOK 1.
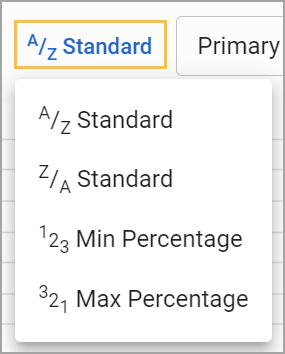
Step 2: Choose how you want the graph to represent the learning standard. Learning standards are sortable by order and percentage:
A/Z Standard
Z/A Standard
¹2₃ Min Percentage
³2₁ Max Percentage
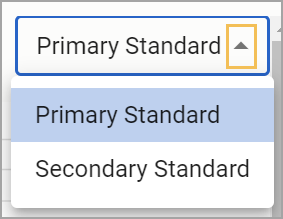
By default, the dataset will only display Primary Standards. Use the drop-down menu and select Secondary Standard to view any applicable Secondary Standards. The graph presents each set of standards separately to avoid cluttering the graph with too much data, especially for assessments with a high number of questions.
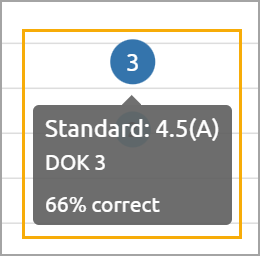
Step 3: Study the graph’s visual representation of the learning standards, questions, and average percentage of correct scores. Hover the cursor over any graph circle to see the Learning Standard, including information on if it is Readiness, Supporting, or a Process Standard for that grade level; Depth of Knowledge level; and percent correct.
Below the graph, you can quickly view the number of questions and which learning standards apply to each Depth of Knowledge level under Standard. Some learning standards may be assigned to more than one question.
Step 4: Click on a learning standard column shown on the graph to receive a breakdown of correct score percentages for the related questions.
The Standard section will update to display this breakdown. For example, clicking on Primary Standard 8.3(C) shows that the average percentage of correct scores was 78.26% for Questions 4 and 5, and that the question was assigned both DOK 1 and DOK 2.
You can click on another learning standard column to examine it or click on the same column again to return to displaying the entire dataset.
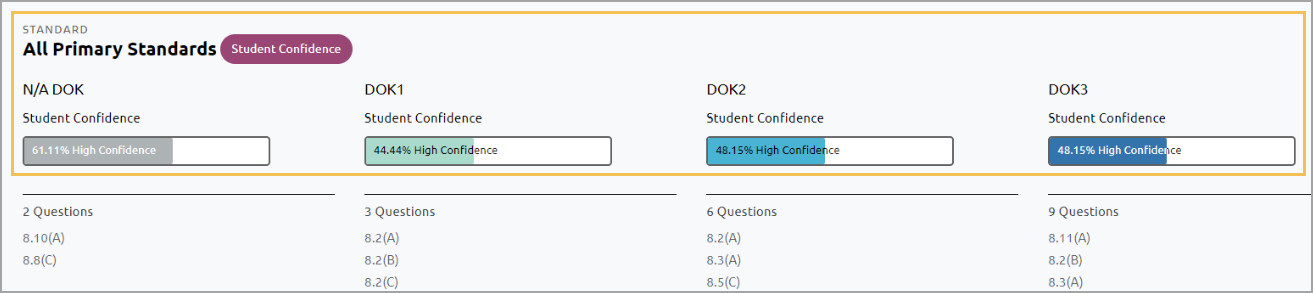
Student Confidence
The Learning Standard Summary tab will also display Student Confidence percentages by DOK and learning standard if the assessment employs the Student Confidence Rating tool. If a user doesn’t select a standard, a summary of all standards displays under each DOK level.
The total DOK high confidence percentage is calculated by taking all of the questions under the specified DOK level and tallying the high-confidence responses. The count of high-confidence responses is divided by the total number of responses for all of the questions under that specific DOK level. This calculation allows educators to analyze confidence by the DOK of the items on the assessment.
Click on a standard to compare high confidence percentages against the percentage of correct responses to the questions under the DOK level.
The total number of responses includes high confidence, neutral confidence, no confidence, and skipped confidence. This allows the percentage calculation to account for all students and can identify that students are confident with a standard at DOK 1 but struggle at DOK 2 or 3.