Teachers and assessment administrators can use a growth data view template in Aware to compare student performance over time. For example, teachers or administrators can use a Growth Data View for accountability purposes to display student achievement data showing student growth over time from a prior test to a current test.
Using Quick Views to Create Templates
District Administrators can create growth data views for their districts as Quick View templates and share templates with multiple users. A growth data view template can start with any assessment that has set performance levels.
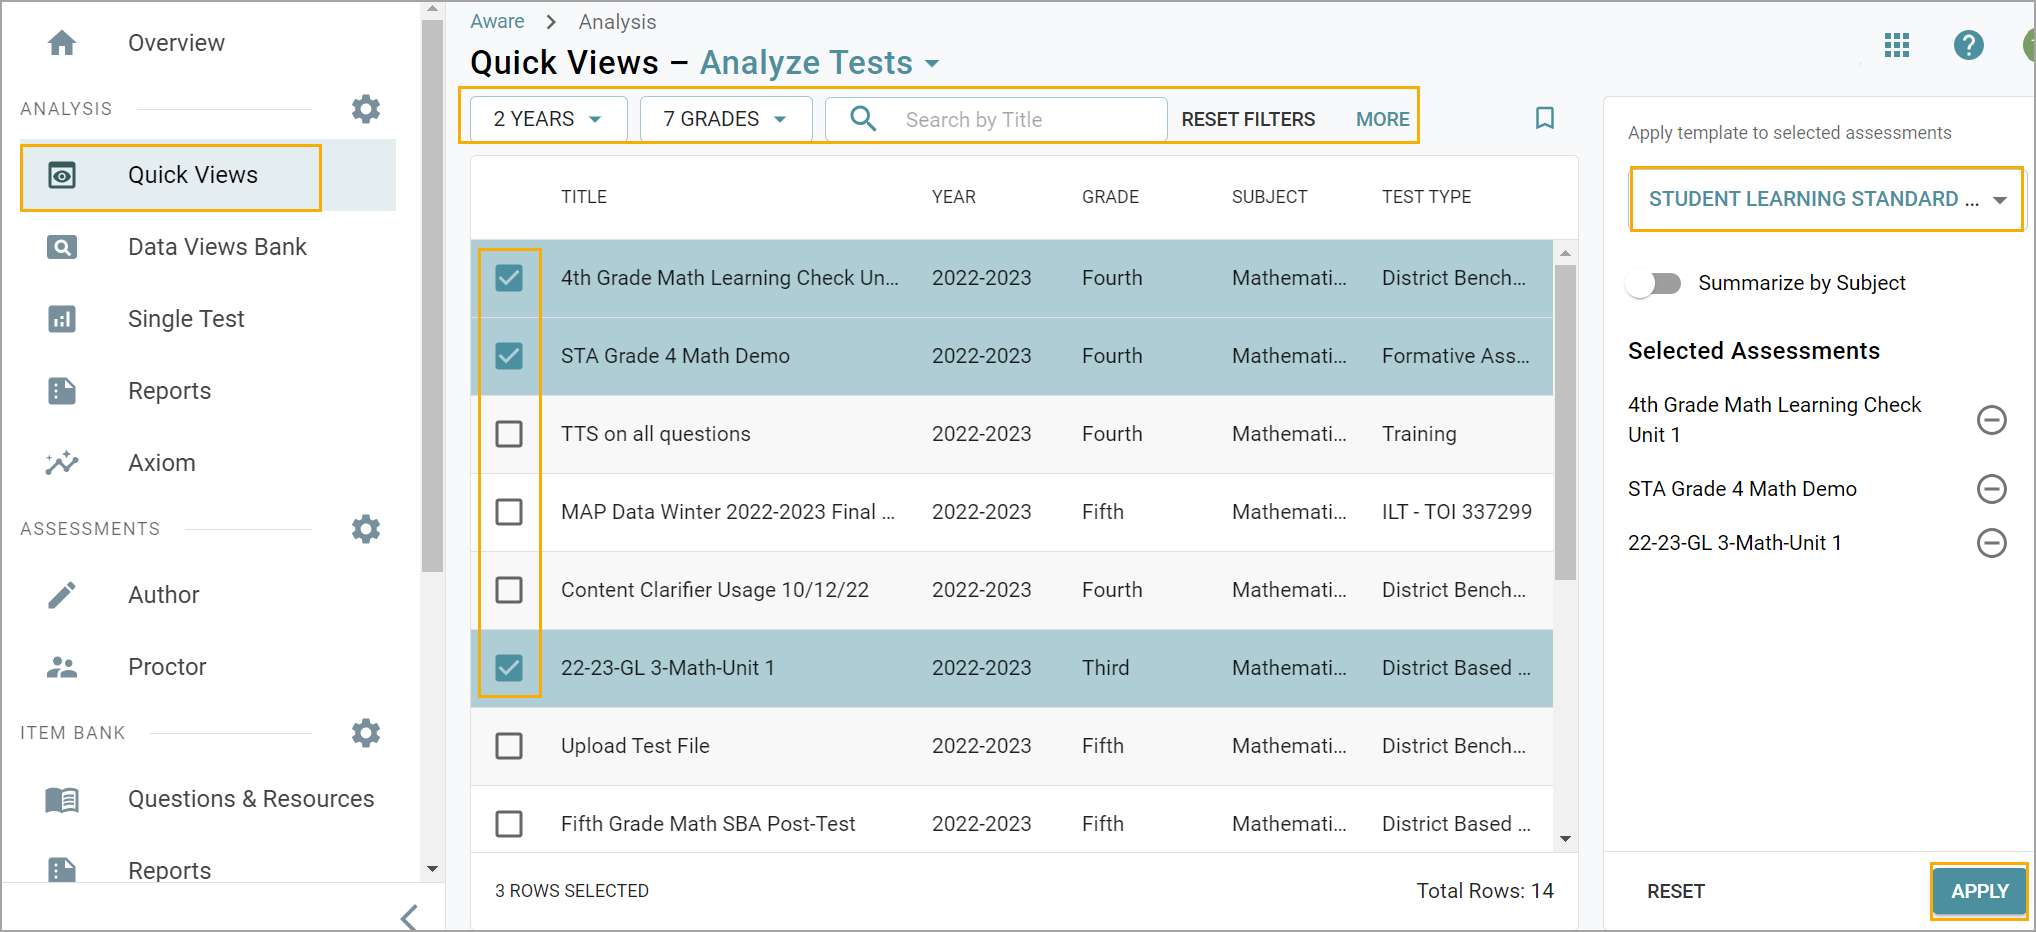
To build a growth data view template, follow the steps in Building Vertical Data Views for Learning Standards, Item Analysis, and Depth of Knowledge.
Saving and Sharing Templates
Administrators can create a sharable template for a single test. Individual staff members will still need to pull at least one other test with the same performance level indicators to make a comparison to complete a growth data view.
To save and share a growth data view template, follow the steps in Saving Data Views and Sharing and Sending Data Views.
Analyzing Growth Data Views
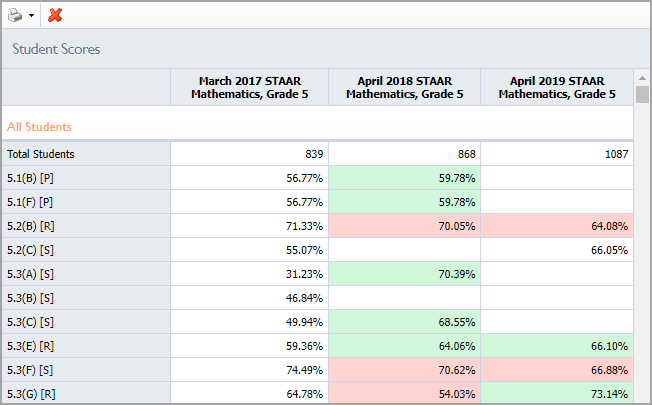
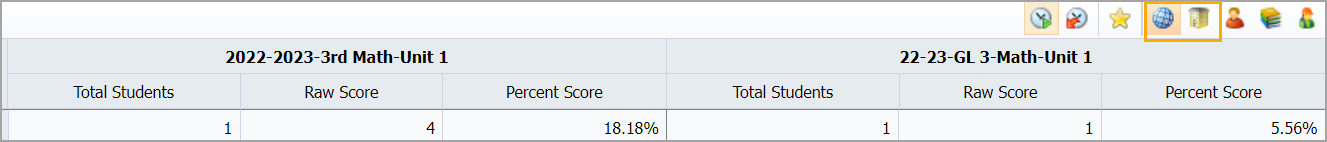
To pull the desired results for analyzing growth data, users must ensure tests have the same performance level indicators selected for Columns. For example, users can compare math assessment data from a previous year to math assessment data for the same students from the current year to analyze growth over time.

District users can select the District Summary or Campus Summary buttons to see areas of need and identify areas of concern that appear in assessment comparisons depending on the user’s goals and role within the district.
Learn more about how to compare and display performance-level data.
Users can build multiple growth data views by selecting different and various columns and filters. Selecting data filtered according to student demographics, teacher of record, or Monitor Groups can reveal data for accountability purposes and student enrichment.
For example, a campus can create monitor groups based on student participation in specific enrichment activities like chess, music, etc. Users can then create a growth data view to evaluate the assessment performance of students enrolled in activities versus students who did not participate.
An administrator could also compare data between specific Monitor Groups over time. For example, assessment data could indicate measurable growth in a tested area for students who participated in a robotics club year over year. These types of metrics could be used to support funding requests and extended initiatives.