The Document Analysis Report allows you to view all data from an appraisal document as well as to analyze that data and prepare it for your Teacher Incentive Allotment (TIA) submission.
Note: Strive's TIA Export report has fields to match the data submission file template provided by TIA. This option might be a better fit for districts that are only submitting the 8 required dimensions from domains 2 and 3. Data from the Document Analysis Report supports the TIA reporting requirements for districts that are including additional dimensions in their TIA submission.
Generating the Document Analysis Report
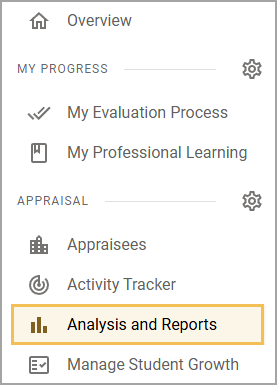
Step 1: In the Appraisal section of the Strive menu, select Analysis and Reports.
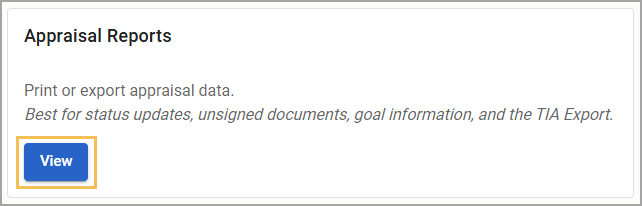
Step 2: In the Appraisal Reports section, select View.
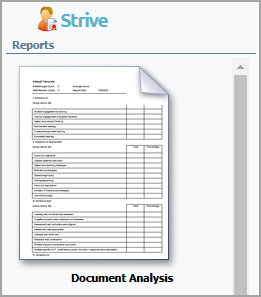
Step 3: Select the Document Analysis report.
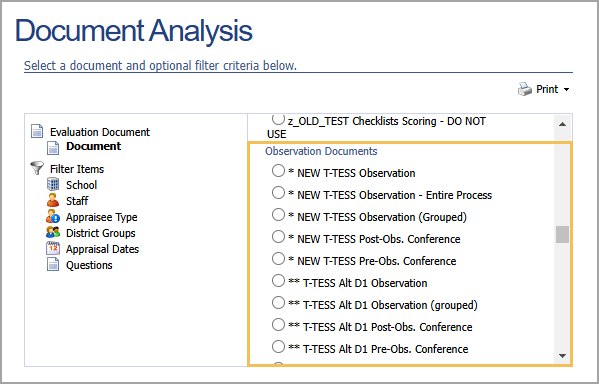
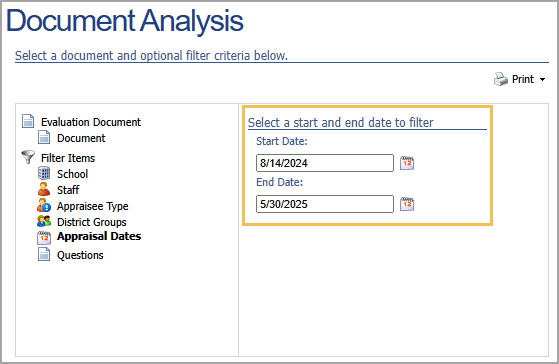
Step 4: Select the Observation or Summative document used in your district's evaluation process.
Step 5: Under Filter Items, select Appraisal Dates. Select a Start Date and End Date to specify a timeframe for the report. If you do not specify the date range, the report uses the start and end dates for the current year.
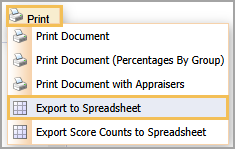
Step 6: To generate the report, select Export to Spreadsheet from the Print drop-down menu.
Formatting the Data for TIA Reporting
The following fields are available within the Document Analysis report and can be used for TIA data reporting:
First and Last Name of Educator
Campus Name
Teacher ID (only if the district has imported IDs into Eduphoria via AD Sync or the user import)
First and Last Name of Appraiser
Dimension Data (for Domains 1-3 in Observations documents, and Dimension Data for Domains 1-4 in Summative documents)
Percentage of Students who Met or Exceeded Growth (requires manual calculation within the spreadsheet and is only available in Summatives where the percentages were collected in the document)
Note: You can add other fields required for the TIA data submission and merge data from other sources into the spreadsheet.
Removing Unwanted Fields
After generating the Document Analysis report, you must format the data. The spreadsheet contains some additional fields that are not necessary to report to TIA, such as the Date and Time of the evaluation and Evidence/Comments columns. Depending on your needs, you can hide or delete these fields.
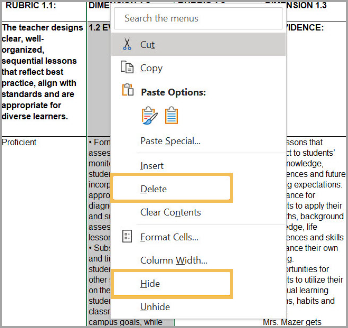
First, open the exported report in Excel or in the spreadsheet editor of your choosing. Right-click the column you want to remove and select either Hide or Delete from the resulting drop-down menu.
Calculating Dimension Ratings in Document Analysis
The report displays the alpha designation for each rating. For calculations or TIA reporting, each dimension requires a numerical rating between 1-5. Representation of each number rating is as follows:
5 - Distinguished
4 - Accomplished
3 - Proficient
2 - Developing
1 - Needs Improvement
Use Find and Replace to convert the alpha ratings to numeric.
Step 1: Use the Find and Replace function(s) in Excel or the spreadsheet editor of your choosing, or use CTRL + H on your keyboard. In Excel, Find is represented by a Magnifying Glass icon in the Editing toolbar.
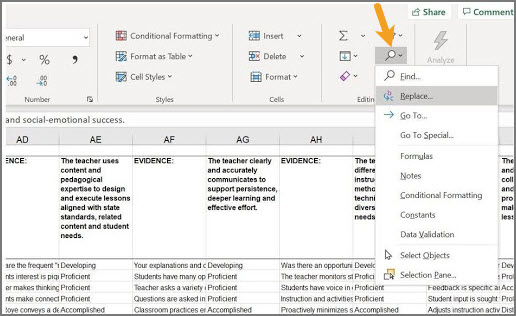
Step 2: Enter a rating and its corresponding numerical value, then select Replace All.
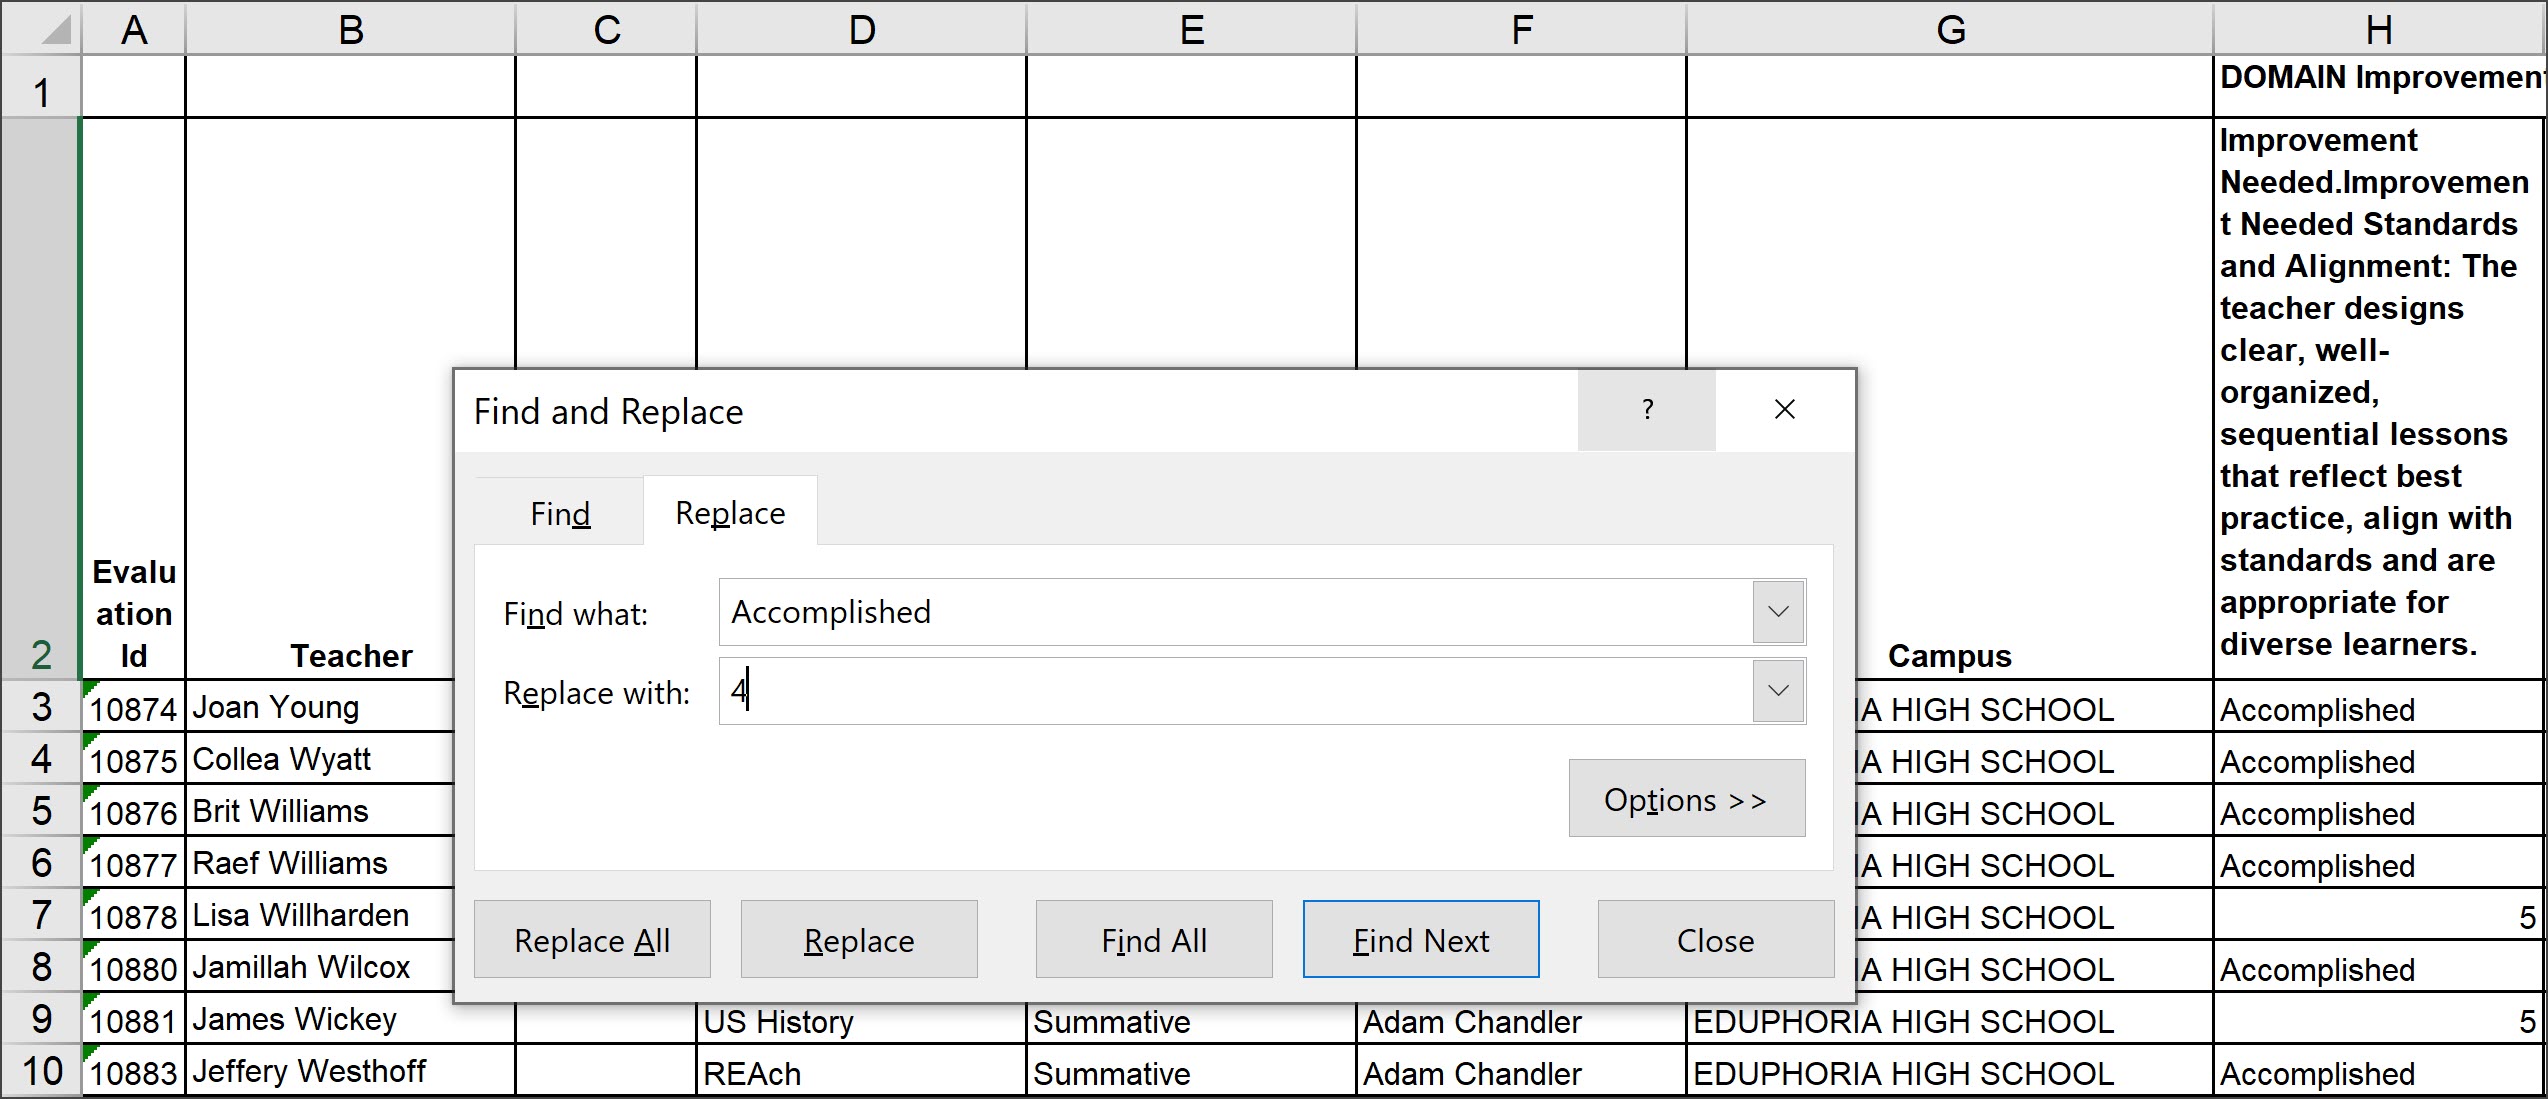
Step 3: Repeat for all other rating levels.
Adding Additional Fields
The fields listed below are required by TIA but not included in the export. You can add this data to the report by adding the necessary headers to the spreadsheet and then merging data from another source:
Middle Name
Internal Teacher ID
Unique ID of the educator
TEA ID of the educator
DOB
Proposed Designation Level (New or Higher only)
Still employed by LEA
Eligible Teacher Group
Main Service ID(s) for Observation and Growth
Appraiser/Rater Unique ID
Once you have added the field headers to your spreadsheet, you can then merge the data from other sources.
You might also need to add columns to your spreadsheet for other data that you included in your TIA application. You can also add formulas as needed.
For example, you can add a column to the right of all your dimension ratings and use the average function to get an average rating. Then drag the corner dot on the formula cell to include all the cells you want to show the average. Alternatively, go to the home screen, open the editing box, use the Fill drop-down menu, and select down to fill the entire column.