Teachers can edit data views in Aware to customize the information to meet their needs. Once a teacher creates and saves a personal data view, they can use it as a template. Teachers can also share saved personal views with other district personnel.
This article shows a teacher’s workflow for creating a new data view to compare a pre-test and a post-test. Administrators have more options to make their custom Quick Views available to teachers.
Building a Saved View to Compare Pre- and Post-Test Data
Quick Guide
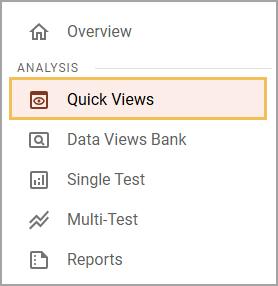
Select Quick Views from Aware’s navigation pane.
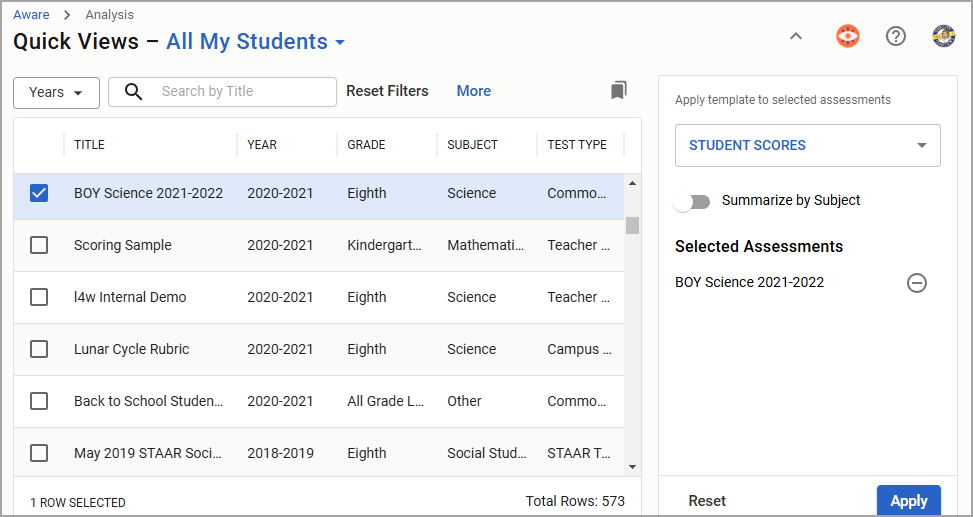
Select a test from the table and click Apply.
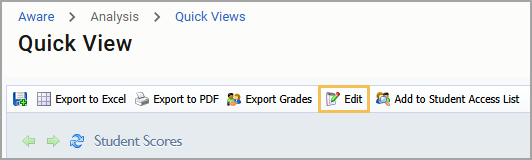
Select Edit.
Select the Tests tab.
Click the Plus sign next to a test type and select the appropriate test to add. Drag and drop it to the right.
Select the Columns tab.
Click the Plus sign next to the Scores folder to display the information options available. Ensure you drag and drop your district’s performance levels into the pre- and post-test data view.
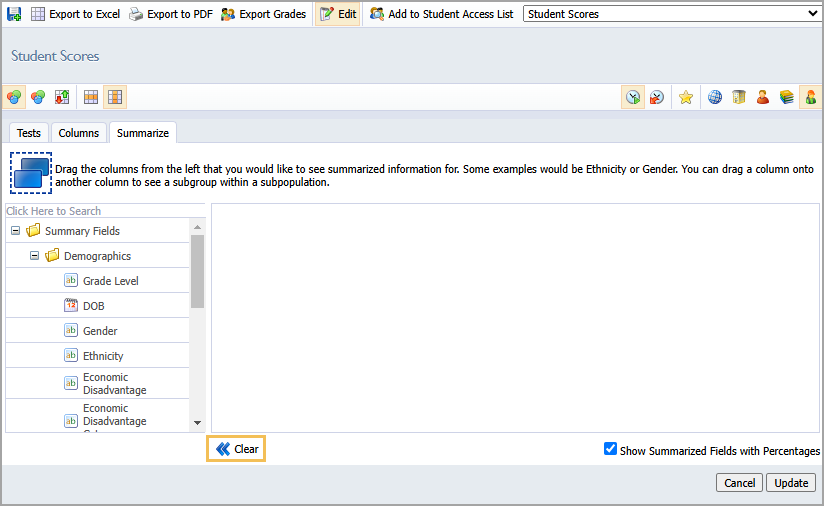
Select the Summarize tab.
Click the Plus sign next to a folder to expand the available options and drag information over to the right. You can also omit this information by selecting Clear.
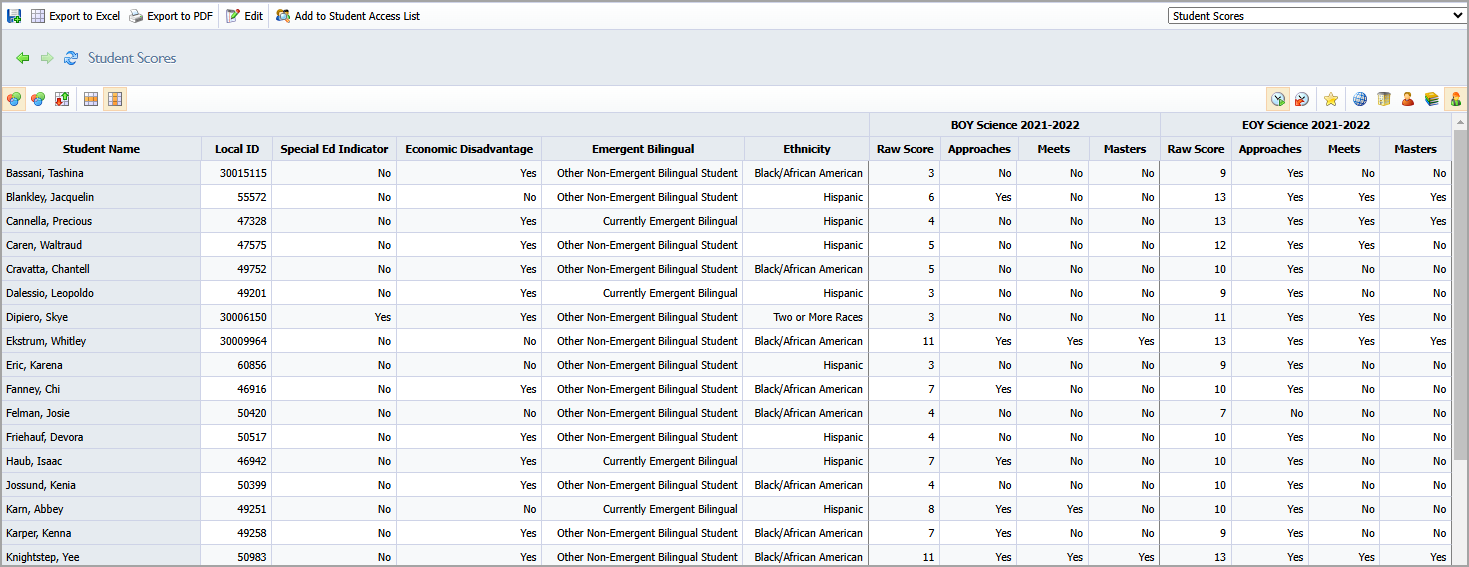
Select Update on the bottom right to display your updated data view.
Click Save As a New View and locate the updated view within the Data Views Bank.
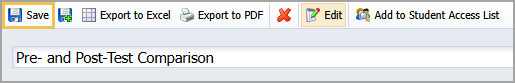
To rename the updated data view, open the view and select Edit.
Type your new title and click Save.
Illustrated Guide
Step 1: Select Quick Views from Aware’s navigation pane.
Step 2: Select a test from the table and click Apply.
Step 3: Select Edit.
Step 4: Select the Tests tab, which displays the test you are currently viewing in the right-hand window. Each folder contains all other tests for the district, which you can add to view and compare the data of multiple tests.
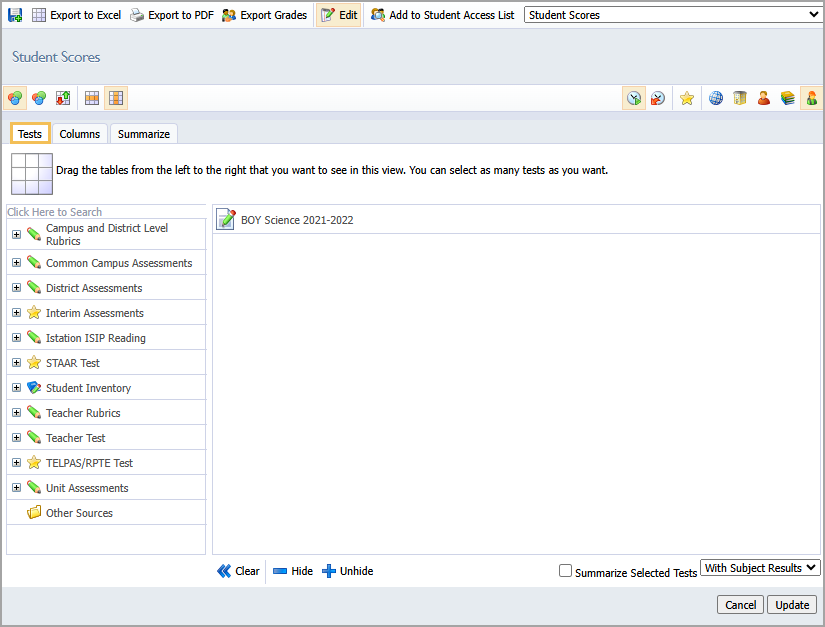
Step 5: Click the Plus sign next to a test type and select the appropriate test to add. Drag and drop it to the right.
To remove a test, drag it back to the left-hand list.
Include the number of assessments you would like to compare on the right. You may drag to reorder the assessments. The tests will appear in your updated report in the same order they are listed in the Tests tab.
Step 6: Select the Columns tab, which contains the actual test information you can view.
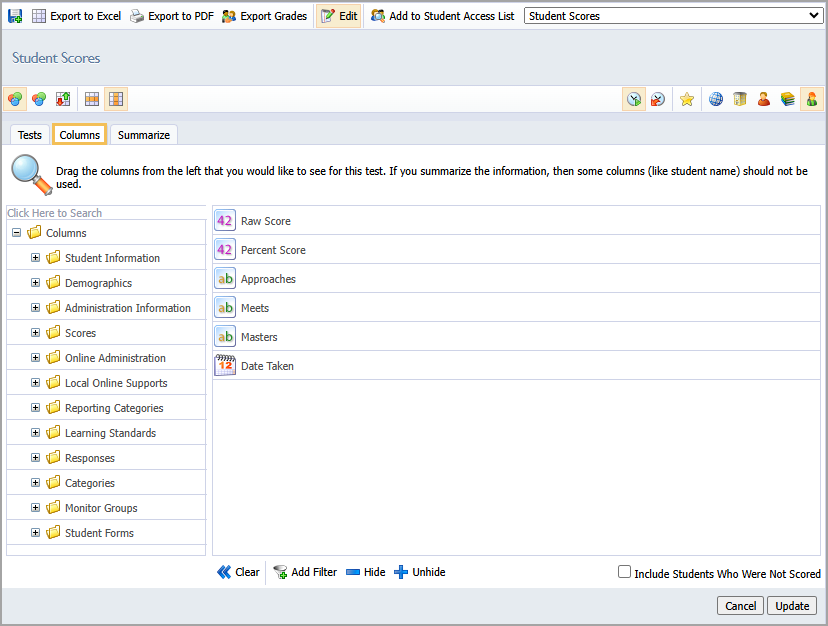
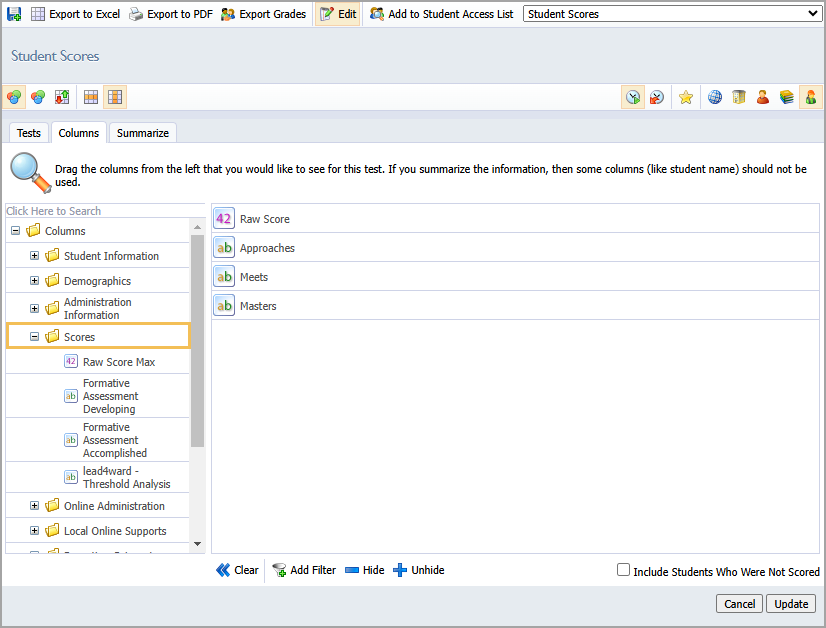
Step 7: Click the Plus sign next to the Scores folder to display the information options available. These options will be the column headings in the view with their information displayed in a table format.
For a pre- and post-test data view, ensure you include your district’s performance levels, which can be labeled differently by district.
To remove a column, drag it back over to the left.
Step 8: Select the Summarize tab to summarize data for the information selected on the Columns tab. The data typically appears as a row on the data view table.
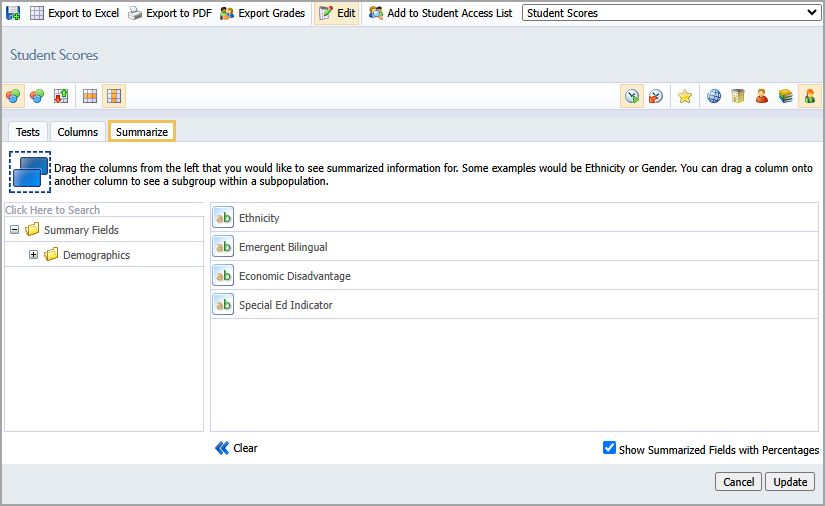
Step 9: Click the Plus sign next to a folder to expand the available options and drag information over to the right. You can also omit this information by selecting Clear.
Step 10: When you’re ready to finalize the view, select Update on the bottom right to display your updated data view.
Step 11: Click Save As a New View.
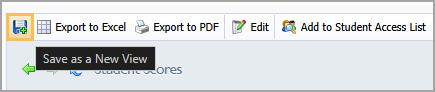
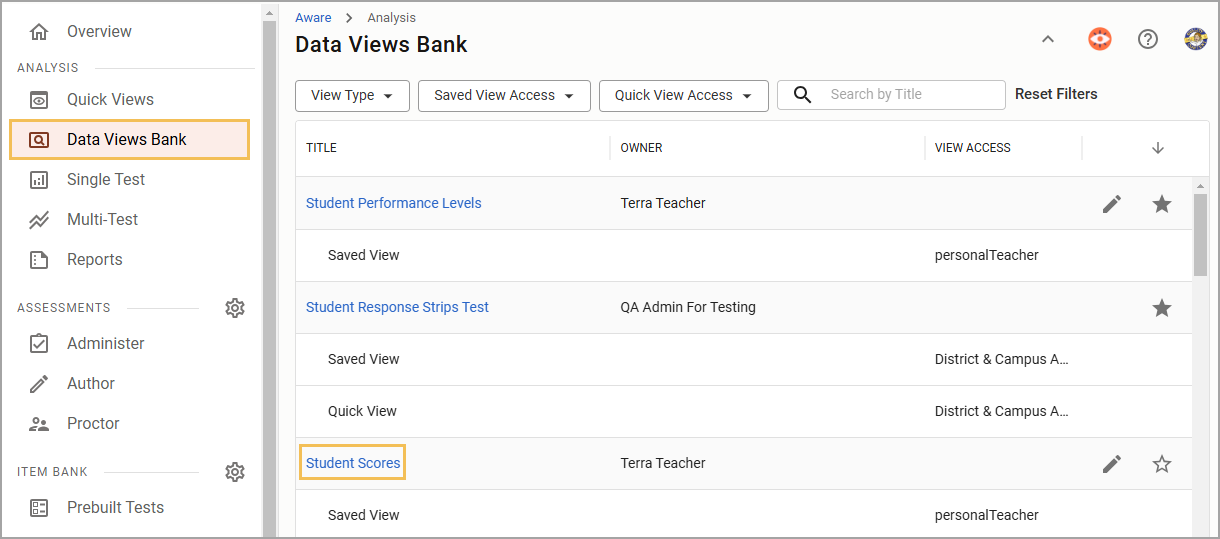
You can locate the updated view within the Data Views Bank. The saved view has its original name.
Step 12: To rename the updated data view, open the view and select Edit.
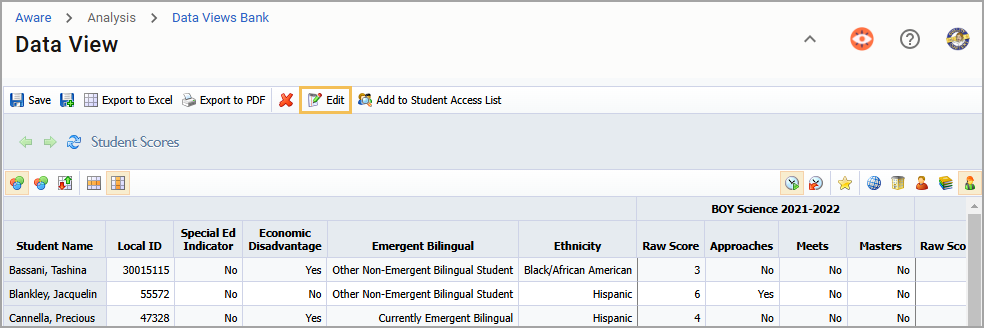
Step 13: Type your new title and click Save.