Quick Views allow educators to transition quickly among summary views to see their student assessment results in various ways. For instance, you can analyze performance level data from local assessments, especially once you understand how the system calculates the percentage of students who earned performance levels.
We at Eduphoria also apply a single methodology to summarizing other fields, such as Learning Standard Performance. Once an educator is familiar with these rules, they can interpret the results with a clearer understanding.
We use total points logic for our summary rules and apply this methodology across all possible summary views. The most prominent examples of when to expect this would be when viewing Reporting Category or Learning Standard summary data.
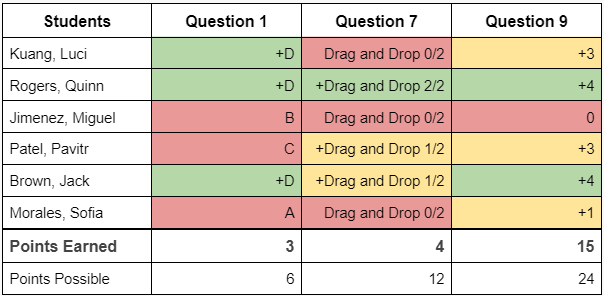
To illustrate how this might work, imagine a test with the following three 4.3(B) items:
Question 1 - Multiple choice, worth one point
Question 7 - Drag-and-drop, worth up to two points
Question 9 - Constructed response, worth up to four points
Next, you have the following sample data:

22 Points earned / 42 Points possible x 100 = 52.38% for 4.3(B)
In this example scenario, total points logic allows for items worth more points to be weighted more in the percent value displayed in the summary view.