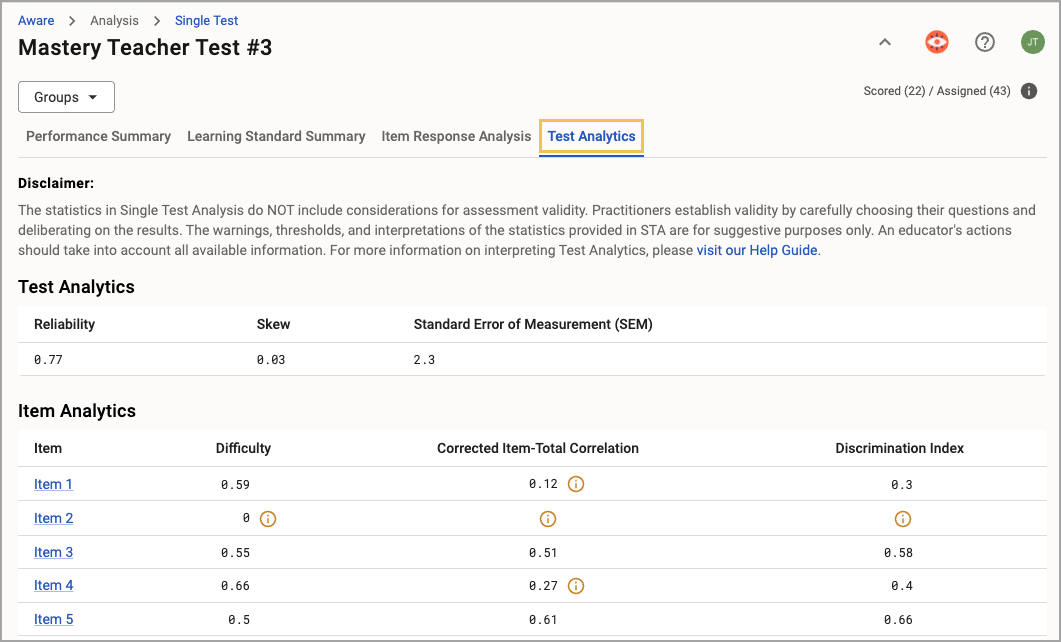
The Test Analytics tab in Single Test Analysis (STA) uses various calculations for the Test Analytics and Item Analytics sections that help ensure test quality, reliability, and precision.
The system makes each calculation using a corresponding statistical formula. Test-level analytics use all data available for the assessment. Item-level analytics use data for each individual item compared in some way to the overall performance on the assessment.
Here, we’ll cover the following topics:

Test Analytics
The Test Analytics section offers the following statistics: Reliability, Skew, and Standard Error of Measurement (SEM).
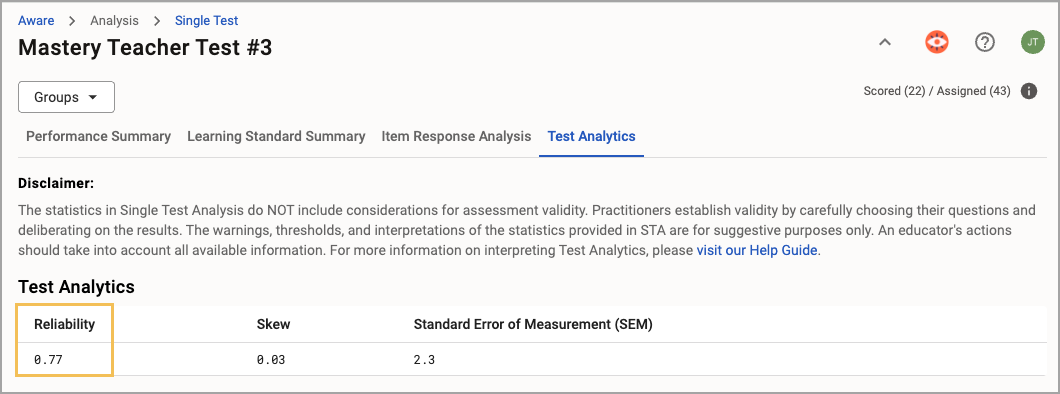
Reliability
STA calculates Reliability using Chronbach’s Alpha. Possible values are between 0 and 1.0.
What It Does
Measures how consistently the test assesses a concept. Higher reliability means the test provides stable, dependable results. In other words, the closer the value is to 1.0, the stronger the reliability is for the assessment. Typically, reliability less than 0.6 indicates a potential need to revise the assessment.
Why It Matters
Overall performance scores derived from reliable assessments can be trusted as representative of student learning for that topic, helping you make informed decisions.

Note: In local assessments, it is not always necessary to have a highly reliable test. For example, it might be appropriate to include items that measure a previous unit even though most of the test is over the current unit. These items might throw off the statistical consistency of the test as a whole but are, nevertheless, valid items.
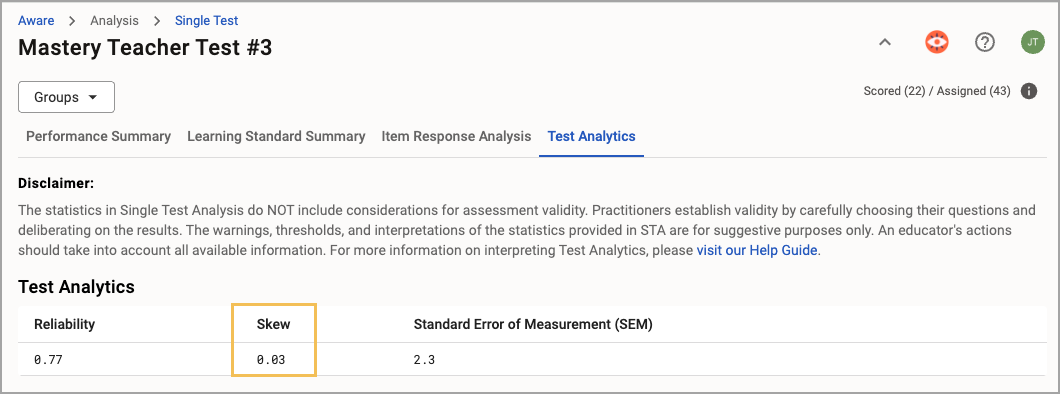
Skew
STA measures Skew by multiplying the difference between mean and median by three and dividing by the standard deviation. Skew does not have a strict limit on possible values, but most typically fall between -1.0 and 1.0.
What It Does
Measures the symmetry of the score distribution. Positive skew means most students scored low; negative skew means most scored high.
Why It Matters
Understanding skew helps identify if the test may be too easy or too hard, allowing for adjustments to better target student ability.

There are three types of skew:
Positive - The raw score distribution has a longer right tail, indicating that more students scored low on the assessment. Values greater than 1.0 indicate unusually strong skew.
Negative - The raw score distribution has a longer left tail, indicating that more students scored high on the assessment. Values less than -1.0 indicate unusually strong skew.
Zero - The raw score distribution is more symmetrical with the raw scores creating tails on both sides of the mean.
Skew values are not necessarily “good” or “bad.” You must take local context into consideration. For example, students who are very well prepared for an assessment might generate a high negative skew without indicating that something is wrong with the assessment. However, a high negative skew may also indicate that the assessment has difficulty issues.
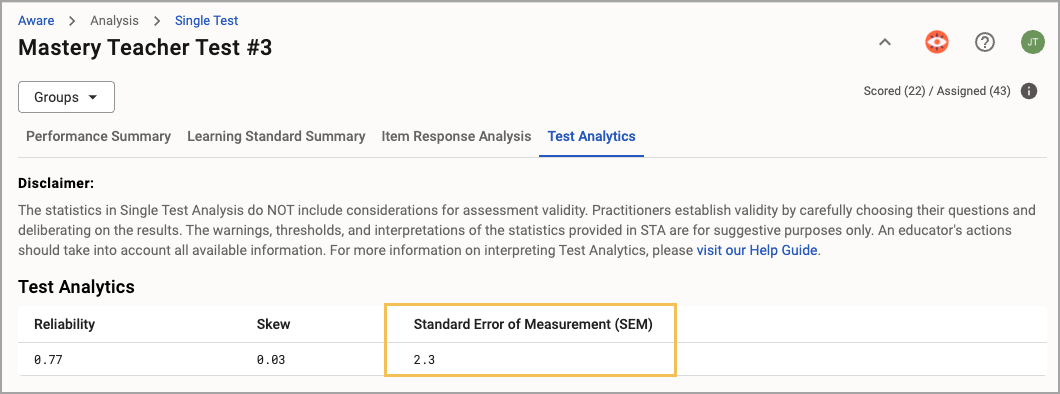
Standard Error of Measurement (SEM)
STA calculates the Standard Error of Measurement (SEM) using the SEM formula, analyzing the standard deviation of test scores for all test takers and the test's reliability coefficient. SEM does not have a strict limit on the possible values, but most typically fall between 0 and 10.0.
What It Does
Estimates the margin of error in a student’s score due to imperfections in the test. A lower SEM means more precise results. SEM is relevant to discussions of reliability.
Why It Matters
Reducing SEM ensures that student scores more accurately reflect their true abilities, making the test results more actionable.

Values greater than 10 indicate unusually high levels of error. Assessments with high SEM may need more items, more balance in item difficulty, or item revision.
Single Test Analysis does not incorporate confidence intervals when reporting the SEM.
Item Analytics
The Item Analytics section offers the following statistics: Difficulty, Corrected Item-Total Correlation, and Discrimination Index.
Difficulty
The test’s Difficulty is a ratio of the number of points earned on an item across all students to the number of points possible for the item. This calculation takes into account the scoring method and item weight. Possible values are between 0 and 1.0.
What It Does
Shows how easy or hard each test item is based on the percentage of students who answer it correctly. Higher values indicate easier items while lower values indicate more difficult items.
Why It Matters
The difficulty index helps balance test items so they effectively assess the intended range of student abilities.

Corrected Item-Total Correlation
The Corrected Item-Total Correlation conducts a Pearson correlation between the individual item’s corrected total score (total raw score earned on the test minus the score earned on the item) and the total score. Possible values are between -1.0 and 1.0.
What It Does
Measures how well each test item aligns with the overall test. A higher correlation means the item contributes meaningfully to the test’s goals. In other words, correlations approaching 0 indicate that the item is not contributing to the assessment in a meaningful way.
Why It Matters
Items with strong correlations ensure that every question is relevant and supports accurate student assessment.

Discrimination Index
STA calculates the Discrimination Index in two different ways, depending on whether the item is worth one point or worth more than one point. The system calculates items worth one point using the Pearson Point Biserial formula. For items worth two or more points, the system uses a Point-Polyserial Correlation Coefficient (or Pearson’s r correlation).
Possible values are between -1.0 and 1.0.
What It Does
Assesses how well a test item differentiates between high- and low-performing students. A higher score means the item is good at distinguishing between students who are stronger or weaker in certain areas. In other words, values approaching 0 indicate that the item does not discriminate well between high-performing and low-performing students.
Why It Matters
Ensuring good item discrimination can provide more confidence in conclusions about student performance on those items. For example, high-performing students are expected not to miss items that low-performing students get right.

You must consider the local context when deciding if the discrimination value indicates an item needs changing. For example, students who are very well prepared for a specific item will likely have lower discrimination scores. However, a low discrimination score may also mean the item is too easy. A negative correlation means that high-performing students tend to miss the question while lower-performing students get the question correct.
General Guidelines for Using the Statistics From STA
The warnings, thresholds, and interpretations of the statistics provided in Single Test Analysis are for suggestive purposes only. An educator's actions should take into account all available information.
Interpreting the meaning behind each statistic requires local context. Each of the following scenarios and explanations below is contingent upon a larger understanding of the behaviors and patterns associated with instruction in the classroom, the preparedness of the students taking the assessments, and overall patterns in your assessment program at the district-, school-, and classroom-level.
Users should review the following general guidelines about using STA statistics:
The statistics in STA do not include considerations for assessment validity. Practitioners establish validity by carefully choosing their questions and deliberating on the results.
Don’t rely on statistics with very few students in the data set. There can be varying thresholds for different situations. A very general but not concrete example would be to use the calculations with caution if there are 50-100 students. If there are fewer than 50, it might be a good idea to not rely on the statistics for important decision-making.
Apply local context whenever possible. Any one of these statistics alone is a vague data point that does not take into account the content of the assessment or the context of the district. For example, questions brought into an assessment from previous content may throw several calculations off, skewing the test’s reliability and offering atypical difficulty and discrimination values. However, bringing questions in from previous content can be a valid assessment practice.
Students are sometimes very well prepared for an assessment, or the purpose of the assessment doesn’t align with the statistical measures (e.g. formative checks are sometimes easy on purpose). Knowing this can add a bit of cushion to the acceptable thresholds for various calculations that the system cannot take into account.
Common Statistical Scenarios
Below are a series of scenarios and relevant questions users can explore when participating in or leading data conversations. These are not exhaustive and do not cover every possible scenario, but they provide a baseline on possible avenues to pursue.
The answer to each of these questions can also be to choose not to do anything to the item. As you explore the local context, you could decide that no edits are necessary and that the purpose of the assessment or the item does not align with the purpose of the calculation.
Reliability (Cronbach’s Alpha)
Values
Below 0.65.
What It Means
Reliability is low, meaning the test may not consistently measure the intended content.
Prompting Questions
Are the test items measuring the same content or skill?
Are there ambiguous or unrelated items causing inconsistency?
Skew
Values
Moderate Skew: Skewness between 0.5 and 1 (positive or negative).
Strong Skew: Skewness greater than 1 (positive or negative).
What It Means
A positive skew indicates most students scored low, and the distribution has a right-hand tail. A negative skew indicates most students scored high, showing a left-hand tail.
Prompting Questions
Is the test too difficult (right skew) or too easy (left skew)?
Are the high/low outliers expected or problematic?
How does this calculation compare to the raw score distribution in the Performance Summary Tab?
When filtering to specific teachers, are there any that stand out as outliers to the district averages? What, instructionally, does that say about what that teacher is or isn’t doing with the content?
Standard Error of Measurement (SEM)
Values
SEM > 10.
What It Means
There is a large amount of error in the measurement of student scores, leading to imprecise results.
Prompting Questions
Is the test too short or inconsistent?
Should additional items be added to increase reliability and reduce SEM?
Difficulty Index
Values
Very Easy Items: Difficulty index > 0.95 (over 95% of students answered correctly).
Very Difficult Items: Difficulty index < 0.15 (less than 15% of students answered correctly).
What It Means
Items may be too easy or too hard for the student population being assessed.
Prompting Questions
Are items that are too easy or too difficult contributing to the test’s goals?
Should overly easy or overly difficult items be adjusted or removed?
Corrected Item-Total Correlation
Values
Low CITC: < 0.20 (suggests the item doesn’t align well with the overall test).
Negative CITC: < 0 (suggests the item is negatively correlated with the total score, possibly confusing or misaligned).
What It Means
The item may not be contributing meaningfully to the overall test score or could be problematic. Remember that some summative assessments, especially BOY assessments, cover a large number of standards, which can throw off CITC calculations without meaning the item is “bad.”
Prompting Questions
How many standards are included in the assessment?
Does the item with a low or negative correlation align with learning objectives?
Should the item be left alone, reworded, removed, or revised?
Discrimination Index
Values
Low Discrimination: < 0.20 (the item poorly differentiates between high- and low-performing students).
Negative Discrimination: < 0 (the item discriminates in the opposite direction, meaning weaker students perform better on it than stronger students).
What It Means
The item may not be effectively distinguishing between stronger and weaker students.
Prompting Questions
Is the item too easy or too hard, leading to similar performance among all students?
How can we improve the item to better differentiate between students of varying ability levels?
In situations of negative discrimination, is the question misleading in some way, causing students to second guess their assumptions or understanding of the content?
Scenarios Where Multiple Statistical Indicators Are Low
Sometimes, you will encounter scenarios where multiple statistical indicators display low metrics. These are not exhaustive and do not cover every possible scenario, but they provide a baseline on possible avenues to pursue.
Scenario: Low Reliability and Low Corrected Item-Total Correlation
Values
Cronbach’s Alpha < 0.60.
Multiple Items with CITC < 0.30 (or negative).
What It Means
The test items are inconsistent, and some items may not be contributing meaningfully to the overall score.
Prompting Questions
Should certain items be revised or removed to improve the test’s consistency?
Are the test items covering different topics or skills that should be separated into different tests?
Scenario: Acceptable Reliability and High SEM
Values
Chronbach’s Alpha > 0.60.
SEM > 10.0.
What It Means
The test is consistent, on average, across the entire assessment. However, there is high variability in the error in student performance.
Prompting Questions
What kind of variation are we seeing in student performance on individual questions?
Which items are the most inconsistent?
Are the questions covering the content they should?
Are the test items covering different topics or skills that should be separated into different tests?
Scenario: Low Reliability and High SEM
Values
Reliability (Cronbach’s Alpha) < 0.60.
SEM > 10.0.
What It Means
The test is inconsistent, and the measurement of student scores has a large error margin. The results may not be precise, and the test may struggle to measure the intended skills accurately.
Prompting Questions
Are the test items too short or lacking in variety, contributing to high variability in scores?
Should we consider adding more items or improving the quality of current items to increase consistency?
Are the instructions or test design clear, or could there be ambiguity causing inconsistent responses?
How can we reduce the error margin to increase precision in students’ scores?
Scenario: Low Difficulty Index and Low Discrimination Index
Values
Difficulty Index < 0.15 (indicating the item is too difficult).
Discrimination Index < 0.20 (indicating the item does not distinguish between high- and low-performing students).
What It Means
The item is too difficult, and it doesn’t help differentiate between students of different ability levels. Both high- and low-performing students are likely struggling with the item.
Prompting Questions
Is this item too complex or poorly aligned with the students’ abilities and knowledge levels?
Should this item be reworded or simplified to better assess the intended content?
Could the item be testing something that wasn’t taught effectively, leading all students to perform poorly?
Is the item relevant to the test’s objective, or does it need to be replaced with one that better aligns with the assessment goals?
Scenario: Low Corrected Item-Total Correlation and Negative Discrimination Index
Values
Corrected Item-Total Correlation < 0.30 (low contribution to the overall test).
Discrimination Index < 0 (negative discrimination).
What It Means
The item is poorly aligned with the overall test, and it may even be misleading. Low-performing students may score better on the item than high-performing students, indicating a potential problem.
Prompting Questions
Does the item’s content differ from the rest of the test? Is it testing an unrelated or confusing concept?
Could the item be worded in a misleading or ambiguous way, causing stronger students to misunderstand it?
Should the item be removed or revised to ensure that it aligns with the construct the test is measuring?
Is there a pattern of low-scoring students answering this item correctly? Why might that be?
Scenario: High Skew and Low Corrected Item-Total Correlation
Values
Skewness > 1 (high positive skew, meaning most students scored low).
Corrected Item-Total Correlation < 0.30.
What It Means
Most students performed poorly, and the low item-total correlation indicates that some items might not be well aligned with the overall test. This could indicate test items that are too difficult or potentially irrelevant to the primary focus of the assessment. In instances where the assessment is a BOY assessment or a pretest of some kind, it should be understood that the content hasn’t been taught yet, and these calculations may not need to be applied to those testing scenarios.
Prompting Questions
Is the test too difficult for the group of students being assessed? Should it be adjusted to match their abilities?
Are some test items too hard or confusing, leading to very low scores?
Should we review the items with low item-total correlation to ensure they are relevant and clear?
Are there topics that weren’t covered in the instruction, leading to unexpectedly low performance on certain items?
Scenario: Low Discrimination Index and High SEM
Values
Discrimination Index < 0.20.
SEM > 10.
What It Means
The test items do not effectively distinguish between high- and low-performing students. The high SEM indicates that the test results may be imprecise, leading to less confidence in the overall scores.
Prompting Questions:
Are the items appropriately challenging for students of varying ability levels, or are they failing to differentiate performance?
Could more items be added to increase the reliability of the test and reduce the error in the scores?
Are the test instructions and items clear, or could misunderstandings be causing erratic responses?
Are the test items balanced in terms of difficulty, or do we need to adjust certain items to better assess a range of abilities?
Scenario: High Difficulty Index and Negative Skew
Values
Difficulty Index > 0.95 (indicating the item is too easy).
Skewness < -1 (strong negative skew, meaning most students scored high).
What It Means
The test or certain items may be too easy, leading to very high scores for most students, and not providing enough challenge to differentiate between different ability levels.
Prompting Questions
Are the test items too easy, causing most students to score high with little variation?
Should we revise the test to include more challenging items that better measure different levels of ability?
Are there enough higher-order thinking or challenging items to assess students’ deeper understanding?
Is the test adequately covering the range of skills intended, or does it only focus on easier content?
Scenario: Low Reliability and Negative Discrimination Index
Values
Reliability < 0.60.
Discrimination Index < 0 (negative).
What It Means
The test is inconsistent, and certain items are misleading, as weaker students are outperforming stronger students on those items. This could indicate issues with the test design or specific items.
Prompting Questions
Could certain items be causing confusion or misunderstanding, leading to unexpected results?
Are the test items designed in a way that fairly assesses the abilities of all students, or are some items misleading?
How can we revise or remove problematic items to improve both reliability and discrimination?
Should we review the entire test structure to ensure it measures a single, consistent construct?