
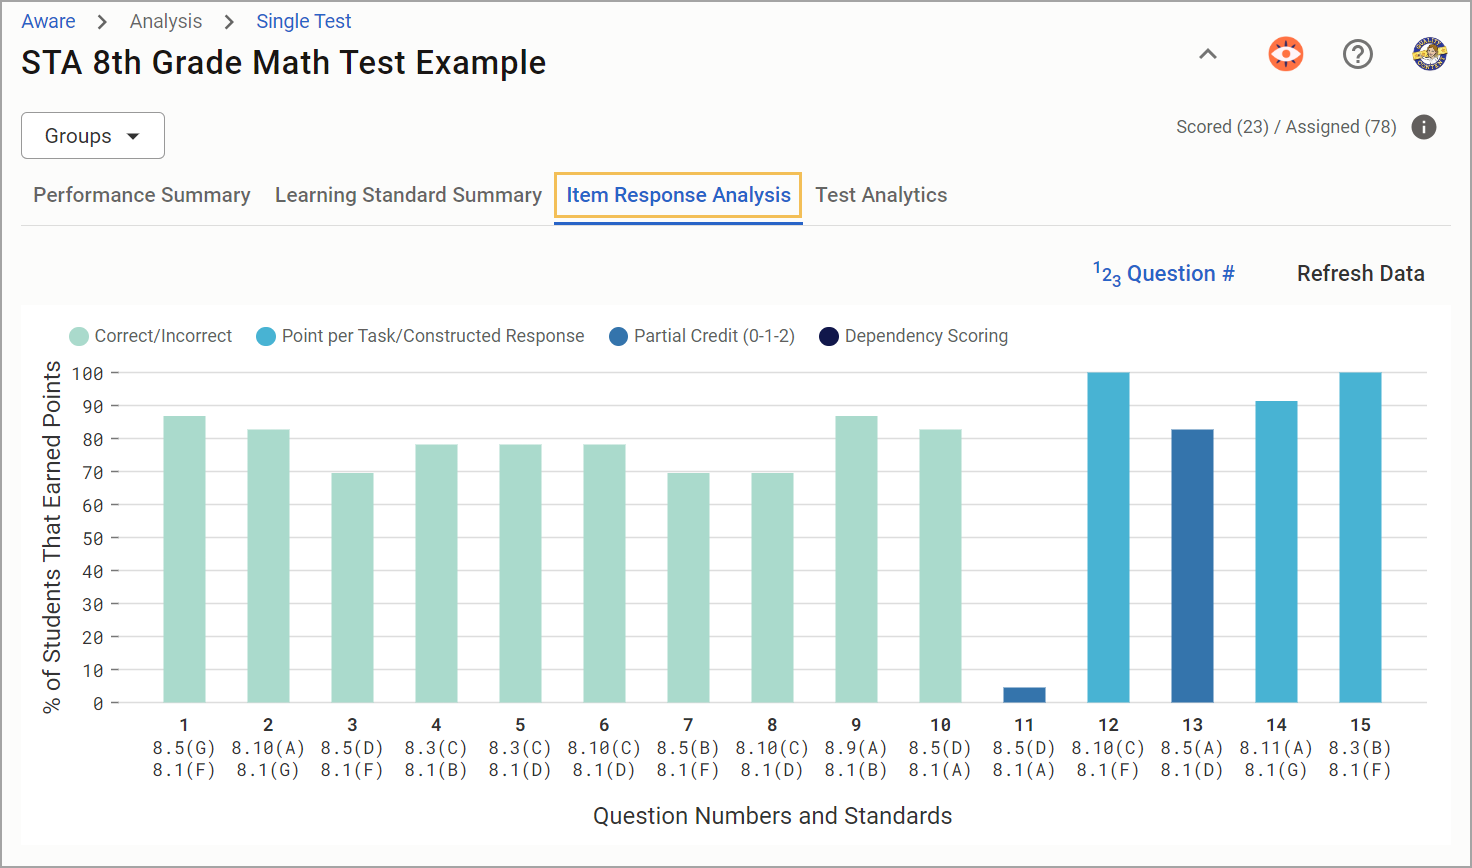
The Item Response Analysis tab in Single Test Analysis (STA) displays all the question numbers, learning standards on an assessment, and the percentage of students that earned points for each question. In addition, the bar chart represents each question’s scoring method, which is included in the legend as the following:
Correct/Incorrect
Point per Task/Constructed Response
Partial Credit (0-1-2)
Dependency Scoring (Multipart only)
This information allows teachers and administrators with data view rights to dive deeper into individual question data to locate patterns and draw conclusions about answer distribution percentages.
Utilizing Item Response Analysis
As you navigate Item Response Analysis, you will see the number of tests scored out of the number of tests assigned to students. These numbers are live and will change as more tests are scored. The dataset changes to reflect your drop-down menu selections if you choose multiple courses as a teacher or multiple schools and testing instructors as an administrator.
Note: The analysis will not include data from students who have not yet taken the test or if there are unscored constructed response questions. However, current data could be influenced by a question’s scoring method. Users must understand scoring types and methods to harness Item Response Analysis effectively.
Step 1: Examine the bar chart, which shows a holistic view of the number of student tests currently scored. The chart represents every question on the test along with the scoring method applied to each and the percentage of students that earned points on each question.
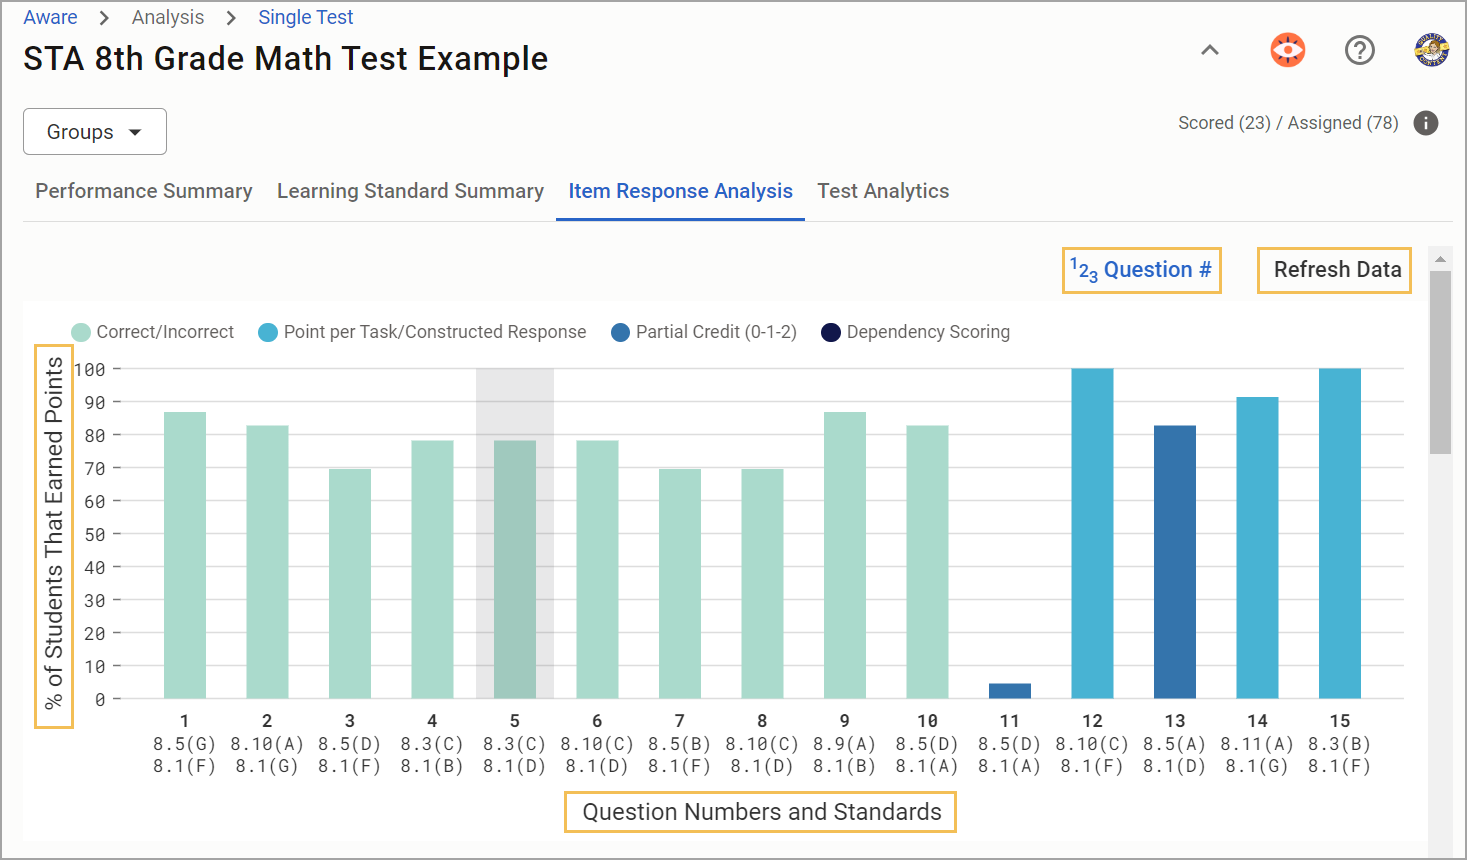
The Question Numbers and Standards axis shows the primary and secondary standards for each question number if applied.
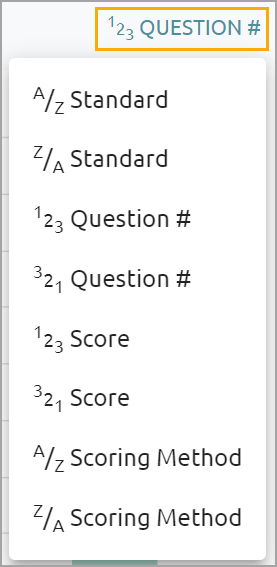
Step 2: Choose how you want to represent the data in the bar chart via the following visual options:
A/Z Standard
Z/A Standard
¹2₃ Question #
³2₁ Question #
¹2₃ Score
³2₁ Score
A/Z Scoring Method
Z/A Scoring Method
Select Refresh Data to refresh reporting data for the Item Response Analysis tab without rescoring the assessment. This option is useful for older tests.
Step 3: Click a question on the graph to dive deeper into the individual item on the assessment.
Below the graph, a detailed item analysis section will load displaying the Item Number, Item Type, DOK, and Learning Standard. You will see the full question as it appears on the test, the correct answer(s), and the answer distribution by percentage of all students.
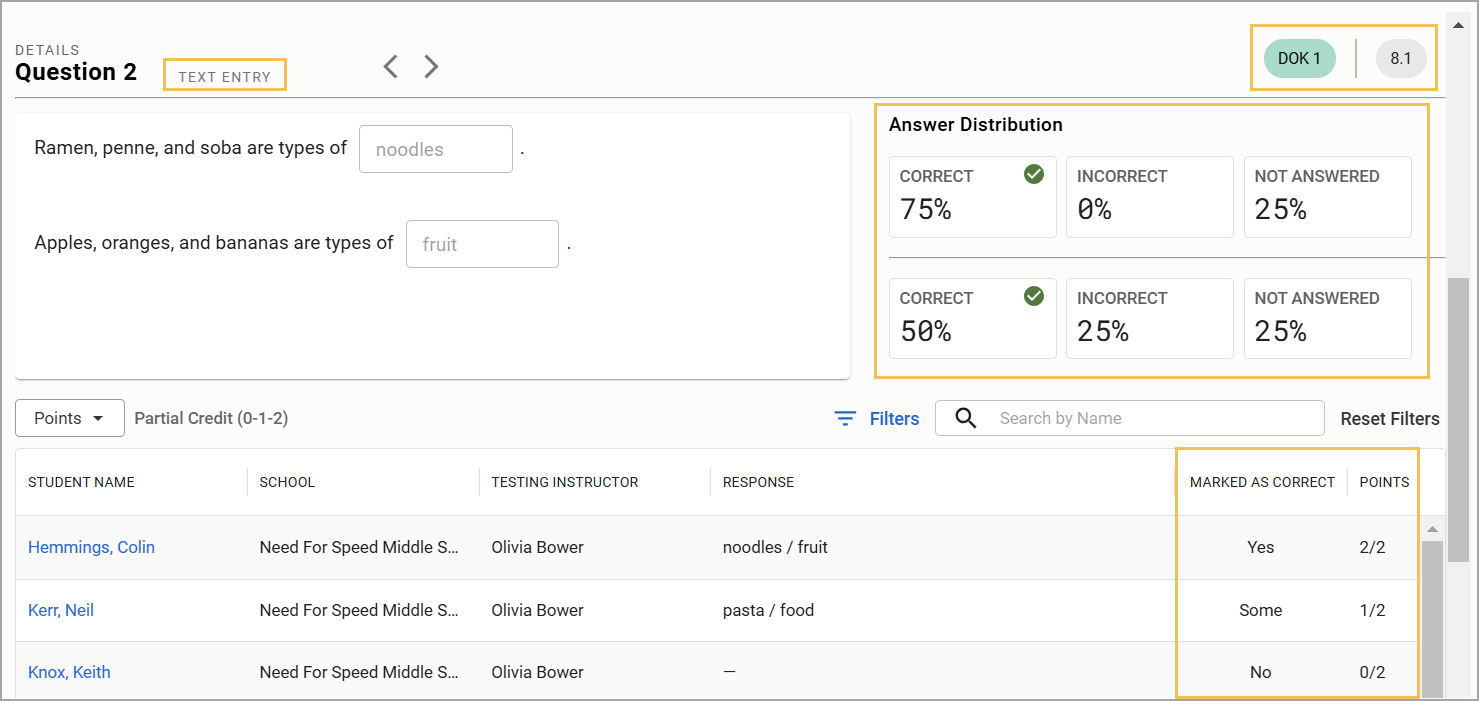
Visually, all item types offer the same process and functionality with a few minor exceptions. Constructed response items show the word or character count if included in the original question settings. Text entry items display any applicable teacher overrides. Finally, match table grid items label cells as A1, B1, etc. in the Answer Distribution section.
Note: When a teacher uses Mark as Correct to score text entry questions, STA shows whether the question was marked as correct. Yes indicates that the teacher marked the entire question as correct. No indicates that the teacher did not mark the question as correct. Some indicates that the teacher marked portions of the question correct, which happens when there is more than one text entry box per question.
Step 4: Examine the list of students under the individual item analysis. This table shows the Student Name, School, Testing Instructor, Response, and Points the student earned out of the possible amount of points.
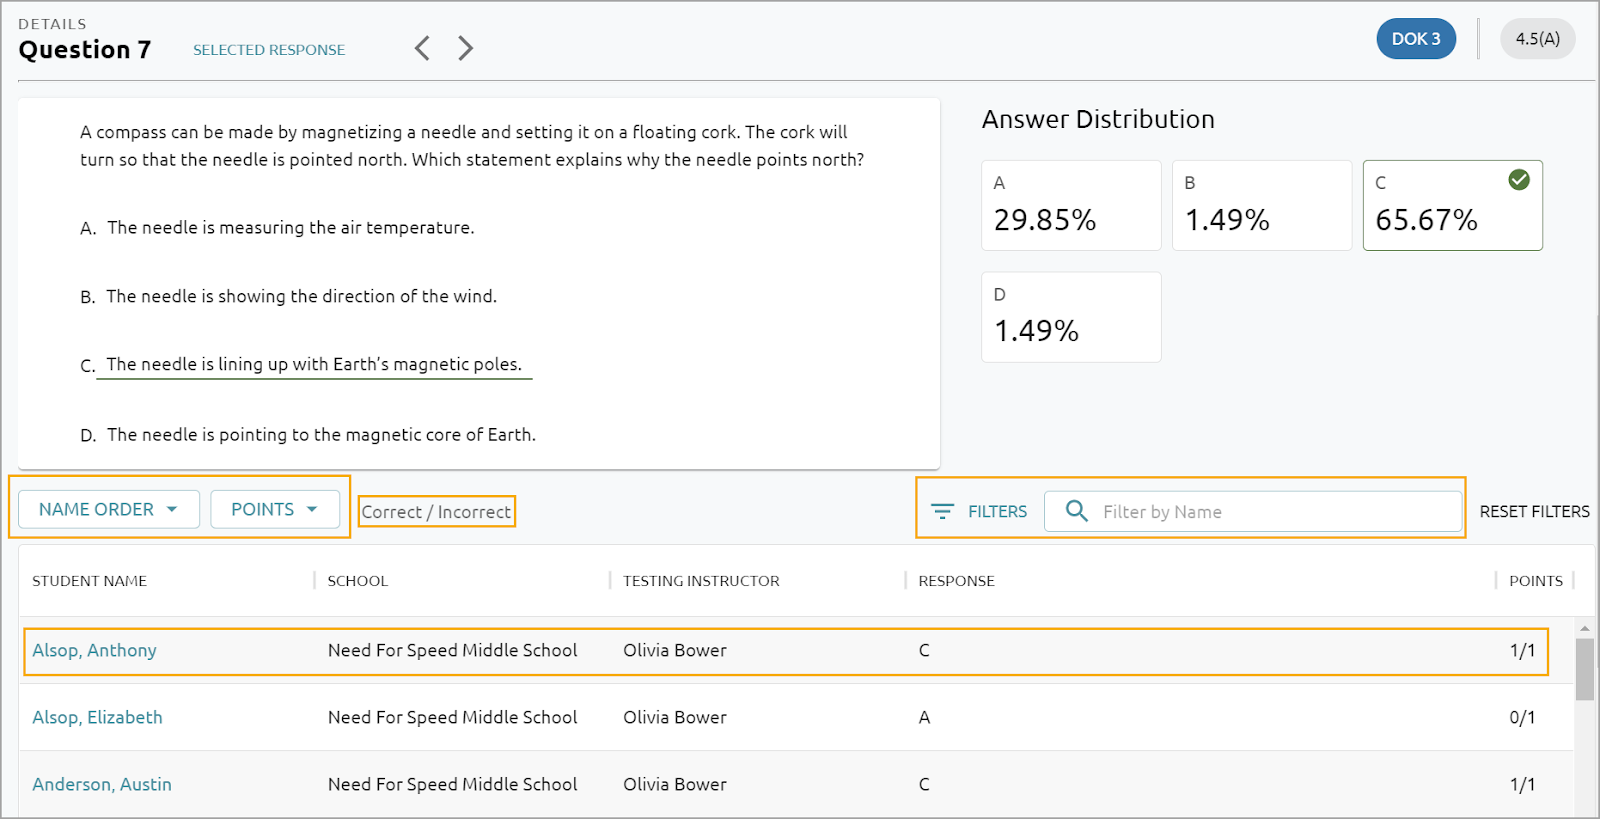
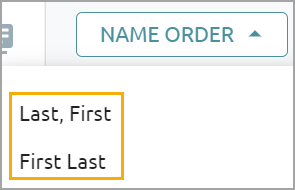
Under the Name Order filter, sort the list by the student’s Last, First name or First Last name.
Under the Points filter, check the boxes to show only the selected amount of points certain students earned and click Apply.
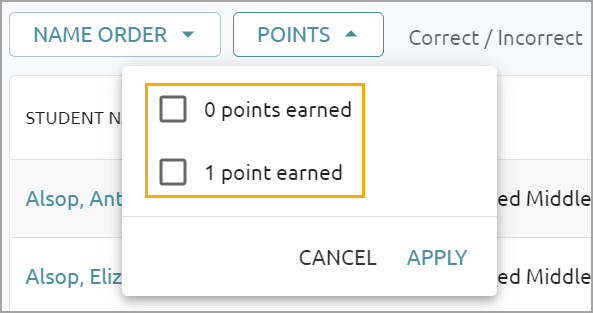
For example, you could select 0 points earned to show only students who didn’t earn points and examine the causes of why they didn’t. The Scoring Method of the item type is also displayed next to the Points filter to help you draw further conclusions.
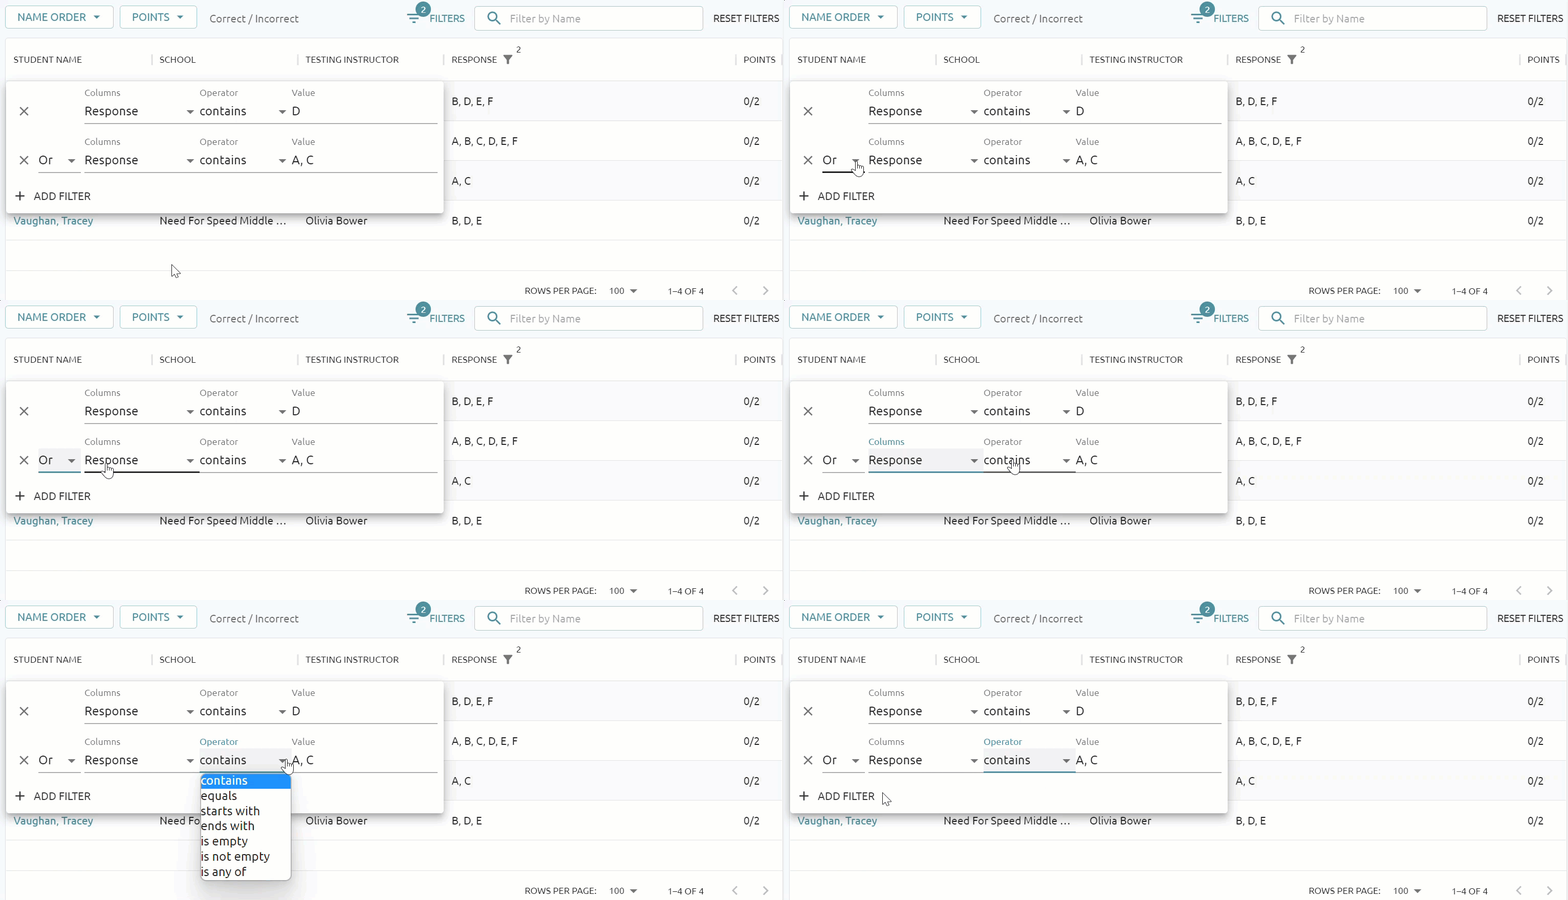
Select Filters to set up additional options by which to sort the student table. For instance, you can set a filter to search under the Response column for any response that contains the answer D. Only students who provided that answer will be displayed on the table. Alternatively, you can search for students by name if you type in the Filter by Name search bar.
Step 5: Click on a student’s name or table row to see their individual answer distribution for the test item.
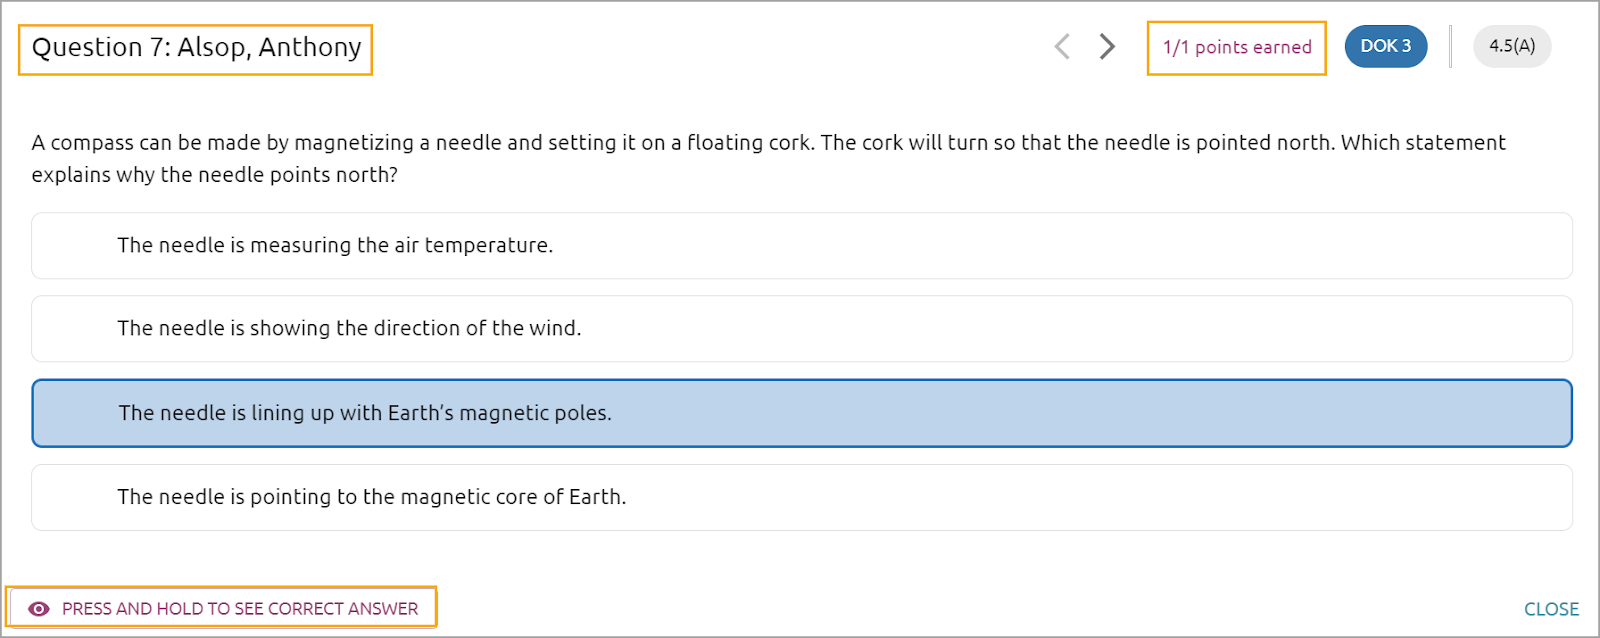
A separate window will open that shows the test item and its possible answers. The student’s answer is highlighted automatically. Use Press and Hold to See Correct Answer to determine how the student’s answer aligns with the correct answer(s).
The window also shows how many points the student earned over the possible amount of points as well as the test item’s Number, DOK and Learning Standard. Select the next and back arrows to toggle to the next student, or select Close to return to the Item Response Analysis table.