Single Test Analysis (STA) and Quick Views are the go-to solutions for quick analysis of student performance on assessments. However, the methodology used to calculate and display performance percentages varies between these data analysis views. This article provides a breakdown of how Quick Views determines a percentage versus how STA does similar calculations.
Standards “Percent Correct” in STA versus Quick Views
When analyzing standards that include questions with Partial Credit or Points Per Task as scoring options, sometimes the calculated percentages are not an exact match.
The example below shows an assessment that includes three questions tied to an individual standard. One question is scored using Partial Credit, and the other two are Correct/Incorrect.
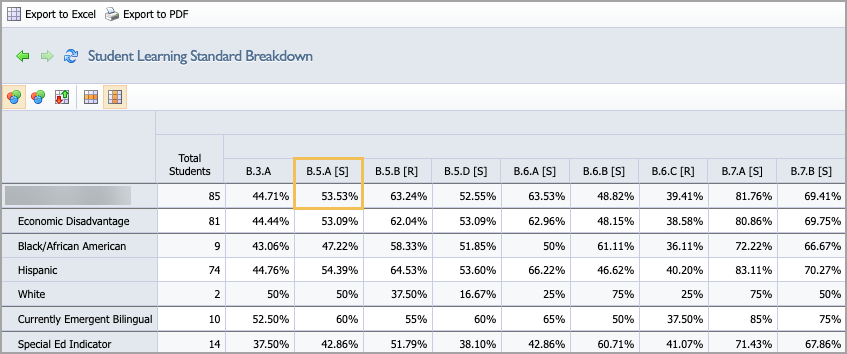
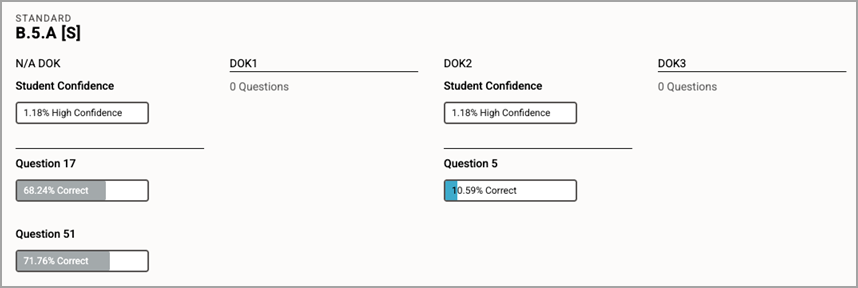
In the Student Learning Standard Breakdown Quick View, the percentage score for B.5.A is 53.53%. This means that 53.53% of all possible points were earned for questions assigned the B.5.A standard.
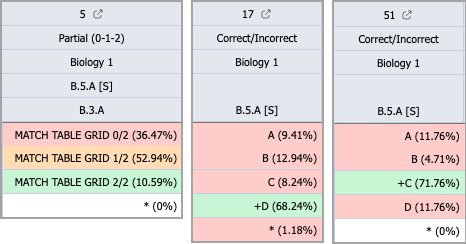
However, when looking at the Student Individual Response Quick View, the three questions that cover B.5.A have percentages that could appear off when comparing these scores to the Student Learning Standard Breakdown Quick View.
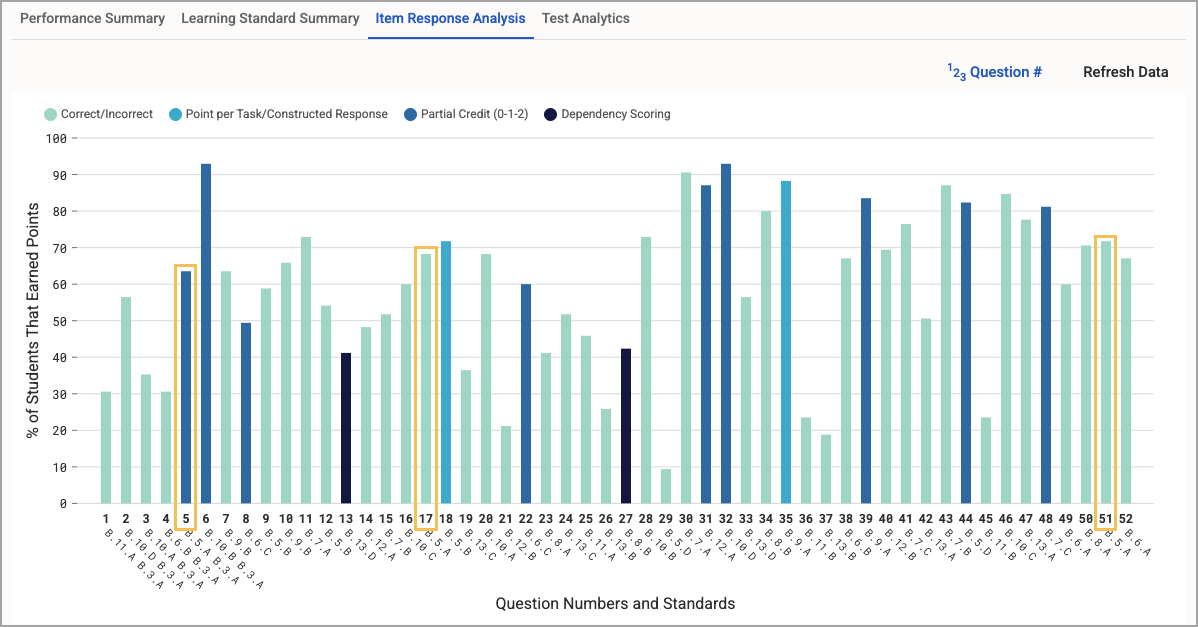
Then, when looking at Single Test Analysis, the Item Response Analysis tab shows that about 63% of students answered number 5 correctly, about 68% answered number 17 correctly, and about 72% answered number 51 correctly. Then you might wonder, how do 63%, 68%, and 72% average out to 53%? Let’s work through each piece one step at a time.
Quick Views - Student Learning Standard Breakdown View and Student Individual Responses View
First, let’s talk about the Student Learning Standard Breakdown and the Student Individual Responses options in Quick Views.
Student Learning Standard Breakdown calculates percentages based on the total number of points earned over the total number of points possible, giving us an overall score for all questions related to the standard.
Student Individual Responses displays the percentage of students who earned a certain number of points on each question, allowing us to calculate the number of actual points earned.
Calculating Total Possible Points
Student Learning Standard Breakdown identifies that questions 5, 17, and 51 cover the B.5.A standard, then determines how many total points can be earned for all of these questions. To do this, it looks at the total number of students and the scoring used for each question. In our example, 85 students took the test.
Question 5 is partial 0-1-2 scoring, meaning students can earn up to 2 points for this question.
Question 5 is a partial scoring question worth 2 possible points. There are 85 kids total, but since the question is worth up to 2 points, that means Question 5 has a total of 170 points that can be earned.
85 students x 2 points = 170 possible points
Question 17 is correct/incorrect, meaning students earn 1 point for a correct answer or 0 points for an incorrect answer.
Question 17 is a correct/incorrect question worth 1 possible point, so there are 85 points that can be earned on this question.
85 students x 1 point = 85 possible points
Question 51 is correct/incorrect, meaning students earn 1 point for a correct answer or 0 points for an incorrect answer.
Question 51 is a correct/incorrect question worth 1 possible point, so there are 85 points that can be earned on this question.
85 students x 1 point = 85 possible points
Then, we add up all possible points for questions that address the standard: 170 + 85 + 85 = 340. In total, 340 points can be earned if all students correctly answer all parts of all questions related to standard B.5.A.
Calculating Actual Points Earned
Now, we determine how many points were earned after administering and scoring the test. To do this, we look at Student Individual Responses, which shows the percentage of students who earned a certain number of points on each question.
On Question 5, 10.59% of students earned 2 points, 52.94% of students earned 1 point, and the rest earned 0 points on this question.
10.59% of 85 students earned 2 points, meaning 9 students earned 2 points for Question 5.
85 × 0.1059 = 9 students
9 students x 2 points = 18 actual points earned
52.94% of 85 students earned 1 point, meaning 45 students earned 1 point for Question 5.
85 × 0.5294 = 45 students
45 students x 1 point = 45 actual points earned
The remaining 31 students earned 0 points for Question 5.
31 students x 0 points = 0 actual points earned
On Question 17, 68.24% of 85 students answered correctly.
68.24% of 85 students earned 1 point, meaning 58 students earned 1 point for Question 17.
85 × 0.6824 = 58 students
58 students x 1 point = 58 actual points earned
On Question 51, 71.76% of 85 students answered correctly.
71.76% of 85 students earned 1 point, meaning 61 students earned 1 point for Question 51.
85 × 0.7176 = 61 students
61 students x 1 point = 61 actual points earned
Then we add up all of the actual points earned for questions that address the standard: 18 + 45 + 0 + 58 + 61 = 182 actual points earned.
Calculating the Final Percentage
Lastly, we set up the final ratio of points earned over points possible: 182 / 340 = 0.535294
Then, multiply that number by 100 (to convert the number to a percentage) and round to 2 decimal places: 0.535294 × 100 = 53.53%
The final percentage shown is 53.53%.
Single Test Analysis - Item Response Analysis
The Item Response Analysis tab in Single Test Analysis is slightly less nuanced compared to Quick Views due to the visual format in which the data is presented. The bar graph shows the total percentage of students who earned any points for the question, rather than the number or percentage of points earned.
Note: The Item Response Analysis tab shows the percentage of students who earned at least some credit for the question. It does not show how many points were earned on questions where multiple points are possible.
Question 5 is worth two points. The image below shows the item preview for Question 5. Here, you can gain a better understanding of the distribution of selected responses and points earned.
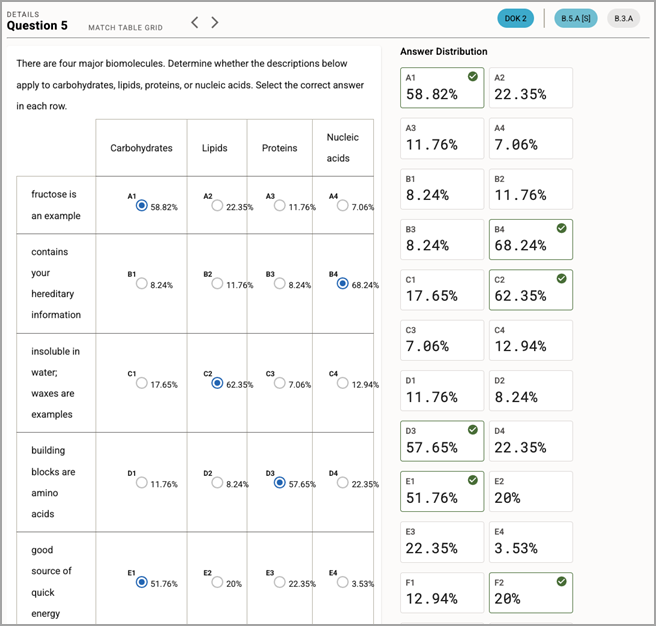
The Answer Distribution shows the percentage of students who selected each target answer. This can help you clearly identify misconceptions and boost targeted intervention.
However, the bar in the graph only represents the total percentage of students that earned any amount of points for the question. When looking at the Student Individual Responses Quick View, we can see 52.94% of the students got 1 point and 10.59% got 2 points for Question 5. When you add those percentages together, you see that 63.53% of students earned some level of credit for this question, which is the percentage shown in the Item Response Analysis bar graph.
Single Test Analysis - Learning Standard Summary
The Learning Standard Summary tab in Single Test Analysis breaks the standard apart by Depth of Knowledge (DOK). If there are multiple questions relating to a standard, they first get separated by what DOK is assigned to them. For this scenario, B. 5. A has 3 questions but 2 DOKs: two questions with No DOK assigned and one with DOK 2 assigned.
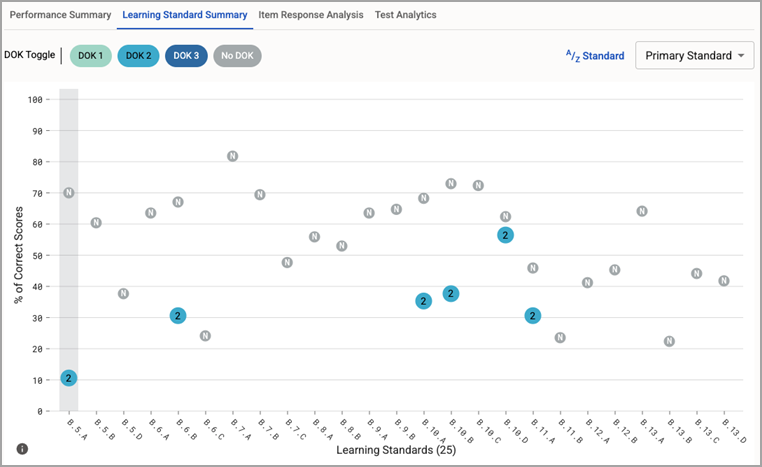
When looking at the standard breakdown we can see that Question 5 is DOK 2, Question 17 has no DOK, and Question 51 has no DOK.
Why does Question 5 show 10.59%? Learning Standard Summary only counts students who earned full credit for the question, because full credit is a better indicator of mastery of the standard for that particular question. When we look at Question 5 in the Student Individual Responses Quick View, we see that 10.59% of students earned 2 points for this question, which matches the percentage shown here.
For Question 17 and Question 51, the dot for the DOK is placed at the percentage of total points earned at full credit over the total possible number of points for those two questions, in this case, about 70%.
The calculation works as follows:
(Q17 Actual + Q51 Actual) / (Q17 Possible + Q51 Possible) = % of Correct Scores
= (58 + 61) / (85 + 85)
= (119 / 170)
= .70
= 70%
If there were more questions that were set at DOK 2 in our example, the percentage for the DOK 2 dot on the graph would look different as it would aggregate all DOK 2 questions and look at all of the students that earned full credit across all of those questions. Keep that in mind when doing deeper dives in other STA views for other tests.
Summary
When analyzing learning standards, you might notice that Quick Views and Single Test Analysis (STA) show different percentages for the same standard. This typically happens on assessments using Partial Credit or Points Per Task scoring and occurs because these types of questions are measured differently to highlight different aspects of the analysis.
View | What does the percentage (%) represent? | What is it best used to view? |
|---|---|---|
Quick Views | points earned / points possible | overall standard proficiency |
STA: Item Response | % of students who earned any amount of points | identifying the difficulty level of a question |
STA: Standard Summary | % of students who earned all possible points | identifying mastery |
In our example, 85 students were tested on three questions linked to standard B.5.A. Question 5 is a partial credit question worth 2 points, while Questions 17 and 51 are correct/incorrect and are worth 1 point each.
1. Quick Views: Student Learning Standard Breakdown and Student Individual Responses
Quick Views calculates the percent correct by looking at the total pool of points available versus what was actually earned by students.
Question 5 is partial 0-1-2 scoring, meaning students can earn up to 2 points for this question. 9 students earned 2 points, 45 students earned 1 point, and the remaining 31 students earned 0 points. Of 170 possible points, 63 points were earned.
Question 17 is correct/incorrect, meaning students earn 1 point for a correct answer or 0 points for an incorrect answer. 58 students answered correctly. Of 85 possible points, 58 points were earned.
Question 51 is correct/incorrect, meaning students earn 1 point for a correct answer or 0 points for an incorrect answer. 61 students answered correctly. Of 85 possible points, 61 points were earned.
Actual Points Earned: 182
Total Points Possible: 340
Calculation: 182 / 340 = 53.53%
2. STA: Item Response
The bar graph in Item Response Analysis shows the total percentage of students who earned any points for the question, rather than the number or percentage of points earned. If this percentage is low, you might review the question to determine whether it is too difficult or requires revision.
In our example, on Question 5, 10.59% earned 2 points and 52.94% earned 1 point for a total of 63.53%. The bar measures at 63.53% because that is the total percentage of students who earned any amount of points for the question.
3. STA: Learning Standard Summary
This view filters by Depth of Knowledge (DOK) and only counts full credit as success because full credit on a question is a better indicator that the student has achieved mastery.
For Question 5 (DOK 2), only the 10.59% of students who earned the full 2 points are counted. Students who earned 1 point are excluded from this "Mastery" calculation. Thus, the dot for the DOK is placed at 10.59%.
For Questions 17 and 51 (No DOK), the dot for the DOK is placed at the percentage of total points earned at full credit over the total possible number of points for those two questions, in this case, about 70%.
The calculation works as follows:
(Q17 Actual + Q51 Actual) / (Q17 Possible + Q51 Possible) = % of Correct Scores
= (58 + 61) / (85 + 85)
= (119 / 170)
= .70
= 70%