![]()
Progress profiles introduce viewing behavior unique to Multi-Test Analysis. View a progress profile either as a rostered-level user (someone with rostered courses) or as a rights-level user (someone with campus- or district-level data viewing rights).
Viewing progress profiles as a rostered-level user surfaces all data for students on your rosters. Use the embedded filters in the progress profile to narrow results to your desired data set.
Viewing as a rights-level user does not differentiate between Analyze Tests, Analyze Subject, and Analyze Grade Level. Multi-Test Analysis surfaces all students you have the right to see and allows you to apply filters in the progress profile to view specific grade levels or student groups as required.
To change the rights-level view, open the progress profile and click the drop-down menu at the top. If you do not have a drop-down menu, no changes to view-level access are possible.
Note: All data in Multi-Test Analysis is reported based on where the students were when the test was administered. Due to how progress profiles are configured and how the data is pulled, Multi-Test Analysis may not match Quick Views.
Summary View Basics
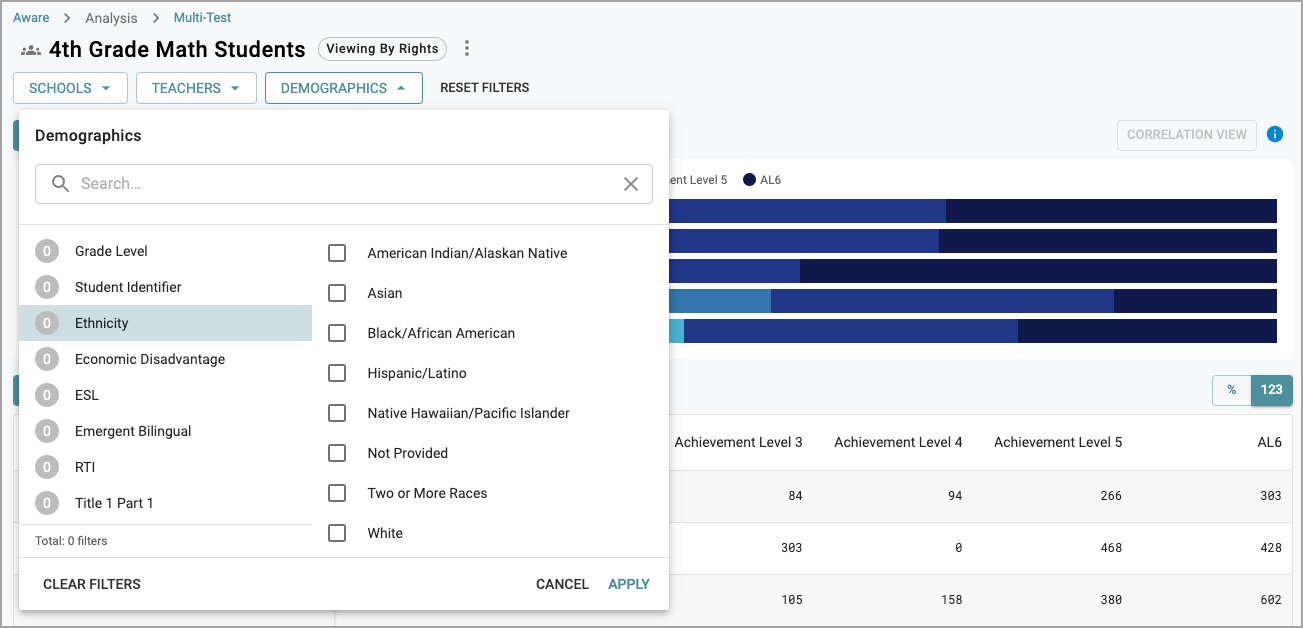
Each summary view includes a graph showing student distributions across the configured Achievement Levels. Each view can apply student demographic filters such as grade level, student identities, ethnicity, and more.
Each view also has common behavior to help organize data in meaningful ways.
Hover over the bars in the graph to see the percent and number of students in each Achievement Level.

Hover over an Achievement Level icon at the top of the graph to emphasize that particular Achievement Level.

Click an Achievement Level in the graph to isolate the data for that Achievement Level.

Applying Filters
Click each filter to see the available options. Applying filters requires the user to select each desired filter and click Apply.
When using the Demographics filter, choose all desired combinations at one time.
Every view in a progress profile uses similar filter sets, which may vary from user to user. For example, teachers with rostered students will see a Groups filter in certain views to filter down to specific class periods. Where possible, the chosen filters will persist when changing views.
To remove all filters, click Reset Filters.
Student View
The default view for a progress profile is the Student view. The Student view displays aggregated information or individual student information as desired. It is not a summary in the same way that quick views provide summary data.
The Teacher, School, and District views are true summary views. Users with access to view data at more than one school can apply School and Teacher filters.
The Student view begins by showing the student data associated with the assessments attached to the progress profile. The Student view is most helpful for seeing how students shift from test to test across Achievement Levels to decide whether overall performance increases or decreases over time.
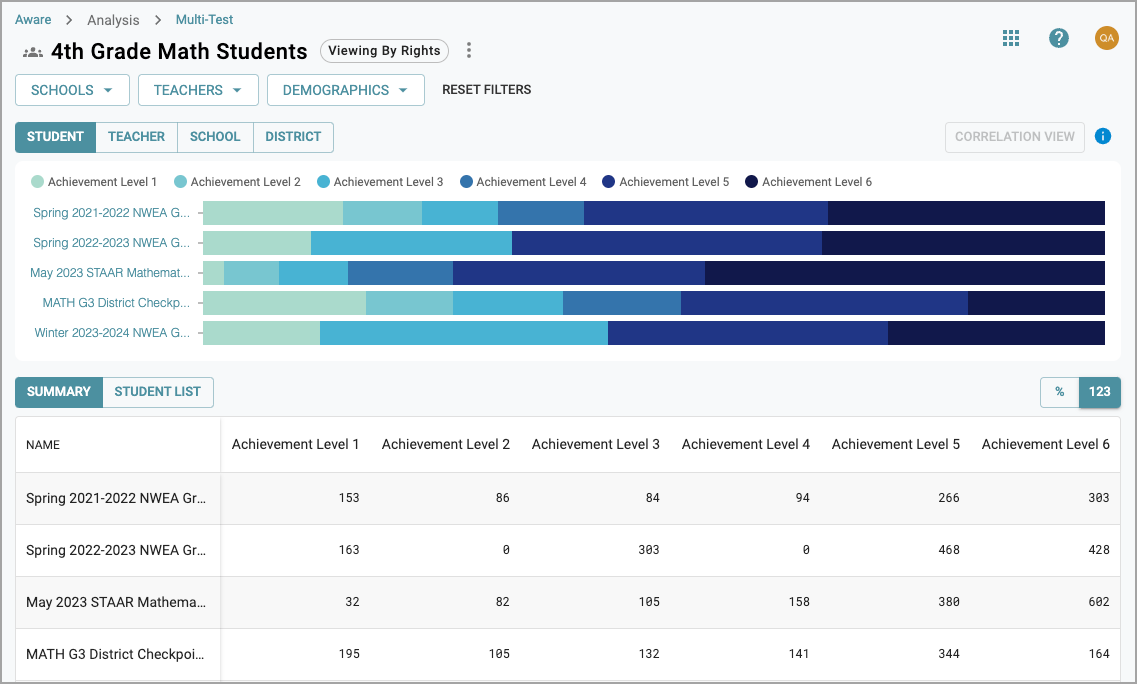
You can toggle between viewing aggregated summary information and a student list.
![]()
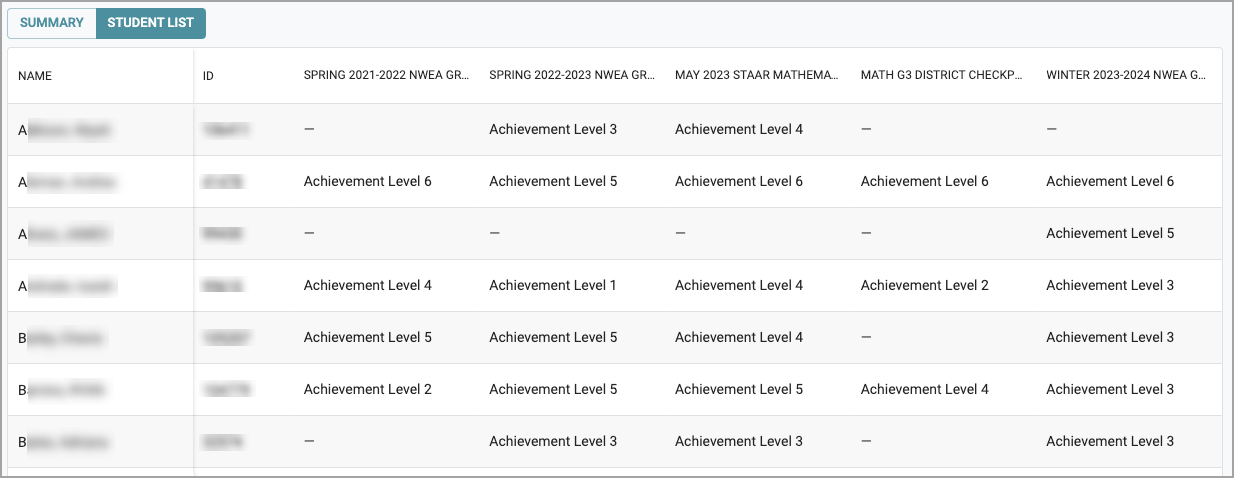
With Student List toggled on, a list of individual students appears with the highest Achievement Level achieved by test. Users can view progress over time by individual students. Blank cells in the student list mean the student’s score did not fall within the configured Achievement Levels.
Clicking the name of a test in the graph opens a detailed view of that one assessment in the table below the graph. The detailed view shows the school, testing instructor, Achievement Level, and metric score for the test selected for all students.
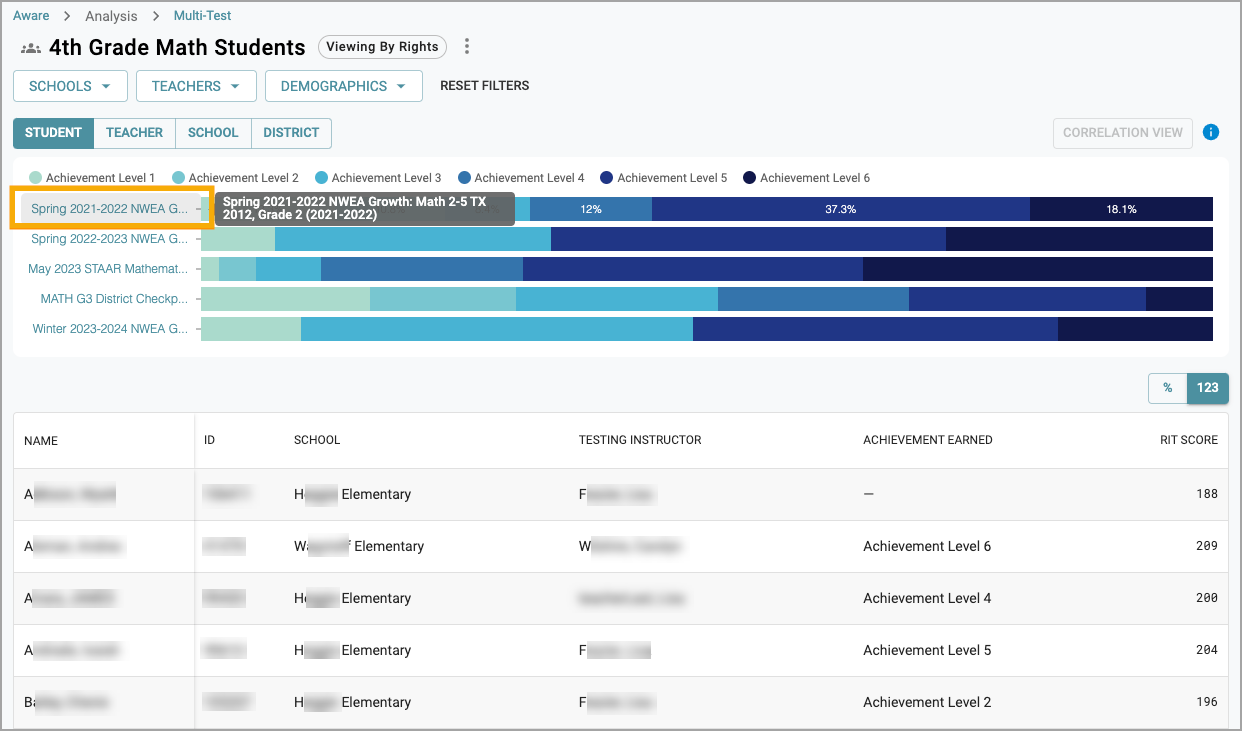
To deselect a test, click the name of a different test or click the same test to go back to the overview of all tests.
Teacher Summary
The Teacher summary view groups the student data by teacher. Only the teachers the user has the assigned rights to see will appear in the teacher summary.
Administrators will see teacher names listed in the table with a summary of numbers in the table’s header. Each teacher will have their own row with Achievement Level numbers organized by test.
The summary numbers reflect the data displayed in the graph and the aggregate of the numbers in the table. Use the filters to drill down to specific campuses or teachers as needed.
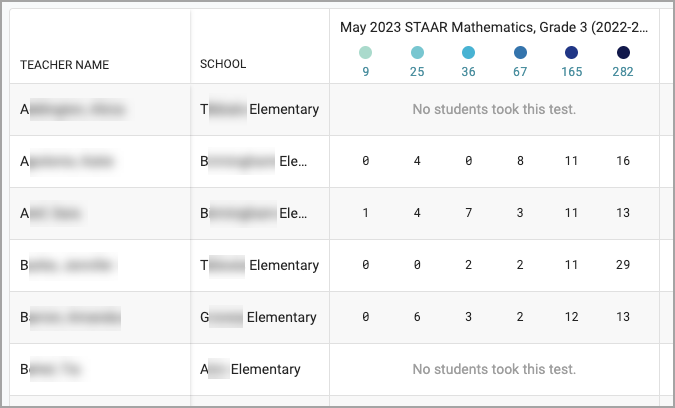
If there is no student data for that teacher, the cells will display No students took this test. Zeros in specific cells indicate that no students fell into the configured Achievement Level for that teacher.
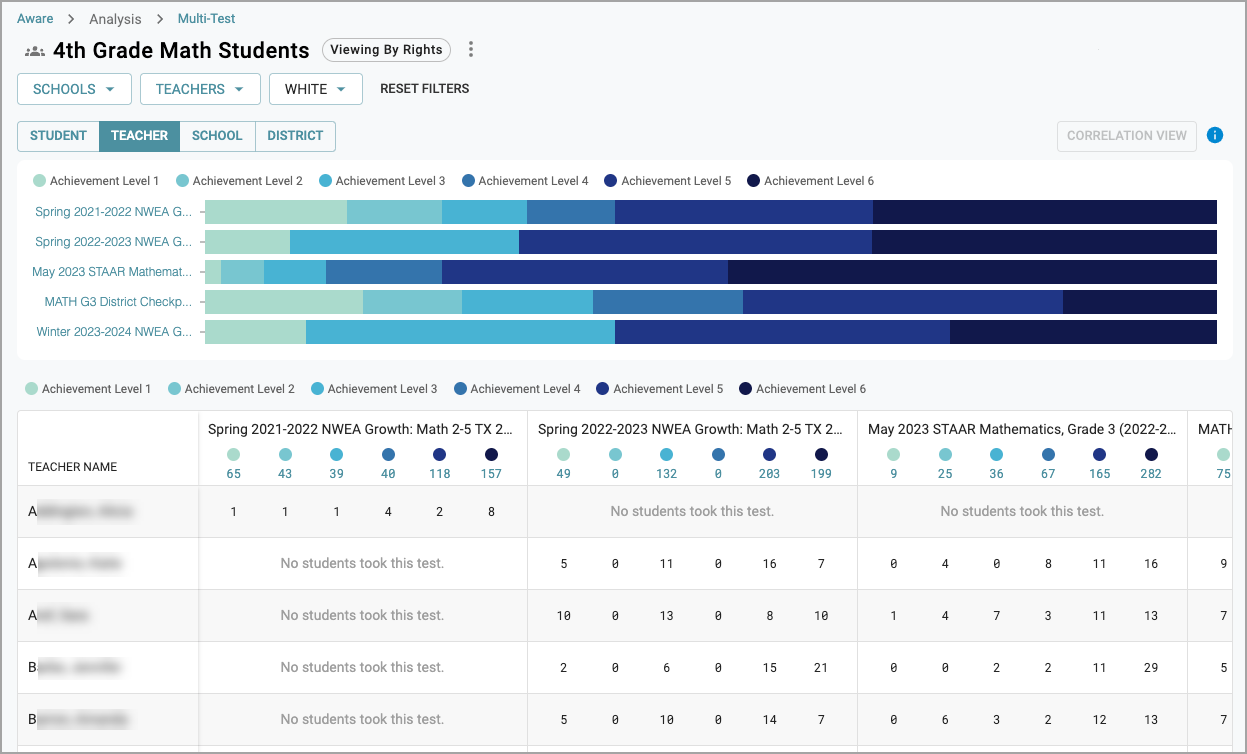
Note: The Teacher summary will not render data for teachers in districts that do not allow summaries for historical assessments for teachers at the same school. Multi-Test Analysis pulls data from a Where They Were perspective, meaning the Teacher summary groups students based on where the students were when tests were administered. Teachers can still view relevant data for historical tests under the Student view.
Clicking the name of a test will show the selected test in isolation.
School Summary
The School summary view groups the student data by school. Only the schools the user has the assigned rights to see will appear in the school summary.
Administrators will see school names listed in the table with a summary of numbers in the table’s header. Each school will have its own row with Achievement Level numbers organized by test.
The summary numbers reflect the data displayed in the graph and the aggregate of the numbers in the table. Use the filters at the top to drill down to specific campuses or teachers as needed.
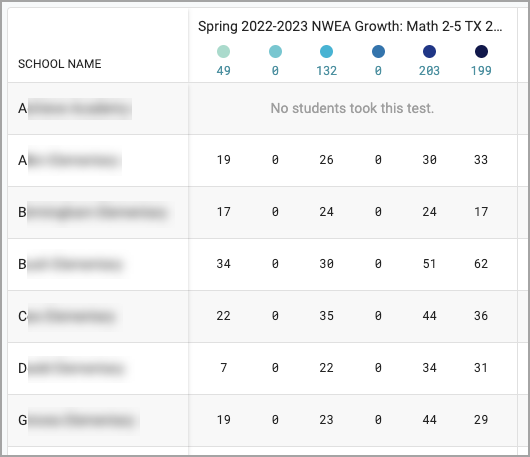
If there is no student data for that school, the cells will display No students took this test. Zeros in specific cells indicate that no students fell into the configured Achievement Level for that school.
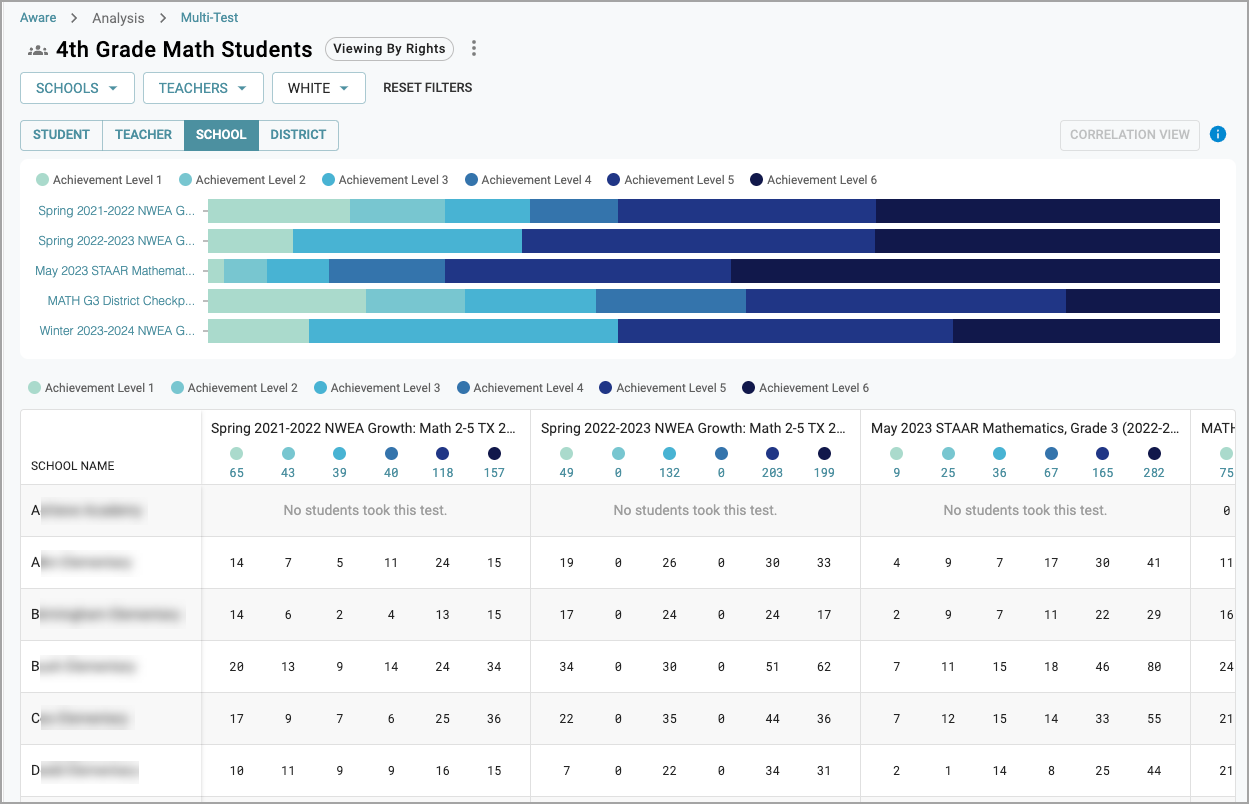
Clicking the name of a test will show the selected test in isolation.
District Summary
The District summary view summarizes all available student data into one district aggregate view. The District view shows test names listed with Achievement Levels across the top, similar to the Student summary view.
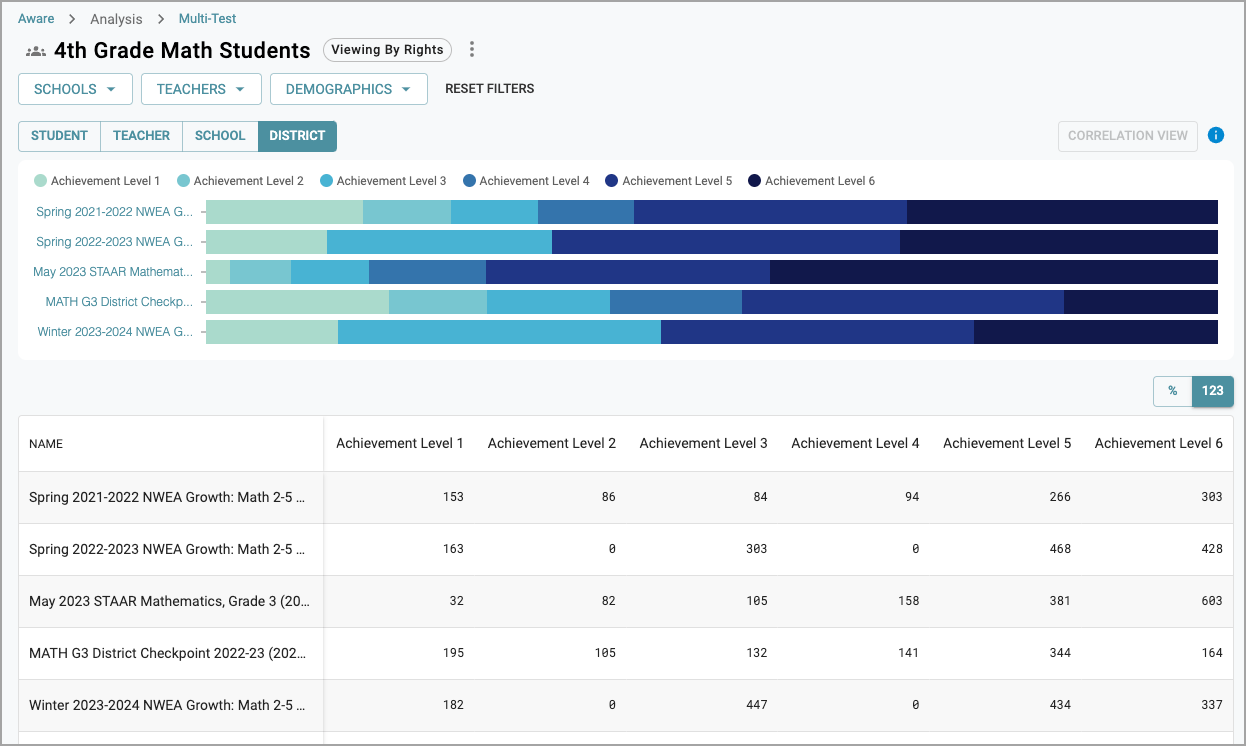
Note: District-level users with access to view all student data will see the same information in the Student summary and District summary. Zeros in specific cells indicate that no students fell into the configured Achievement Level for that school.
Clicking a test name will not change the view in the District summary.