![]()
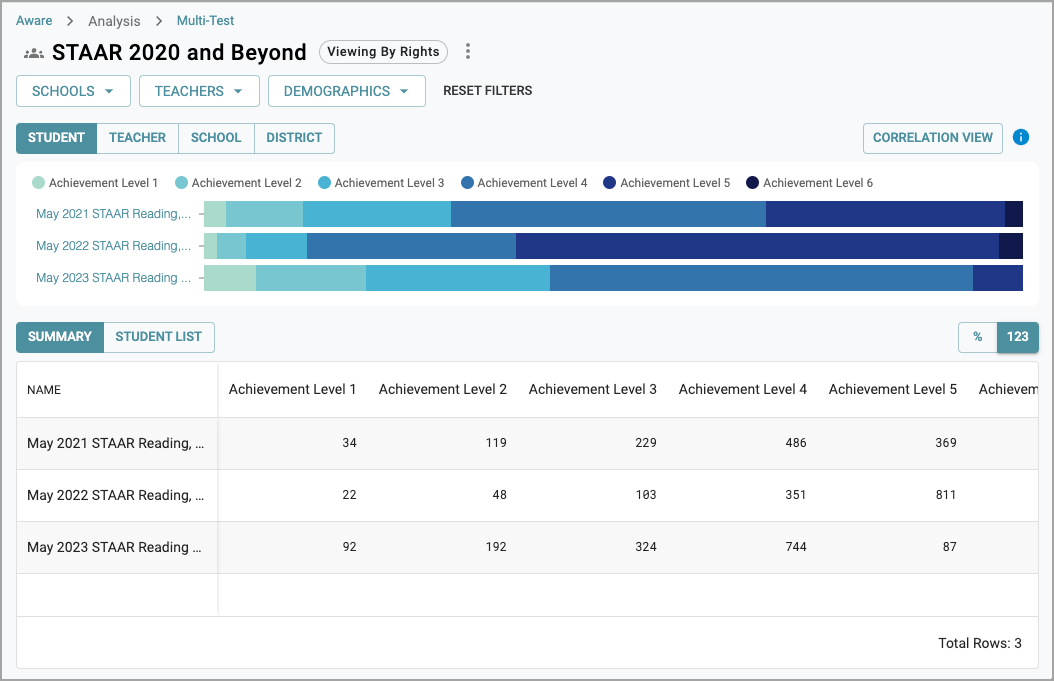
The Correlation View helps users decide if a series of assessments predicts student performance on another test. The Correlation View can also help users determine if the assessments are valid in demonstrating student progress.
If a user selects a comparative test during the configuration of the progress profile, an option to select a Correlation View appears in the interface.

Each progress profile can have only one comparative test. Comparative tests should be summative in nature.
Selecting a comparative test compares that assessment to all other tests connected to the progress profile. For example, you choose an end-of-year assessment as the comparative test. In this instance, the Correlation View compares each test to the summative and could help you decide whether or not the selected tests accurately predict the performance on the end-of-year assessment.
The Correlation View provides additional insight using correlation calculations and showing changes in student Achievement Levels from test to test. These values help users decide if assessments predict another test’s performance. They can also show if the assessments are valid in showing student progress.
For additional information on how correlation works in this data view, explore Interpreting Correlation in Multi-Test Analysis.
The District Correlation Table and Achievement Level Comparison
Independently, the District Correlation Table and the Achievement Level Comparison provide useful information. Together, this information can lend predictive validity to each assessment compared to the comparative test.
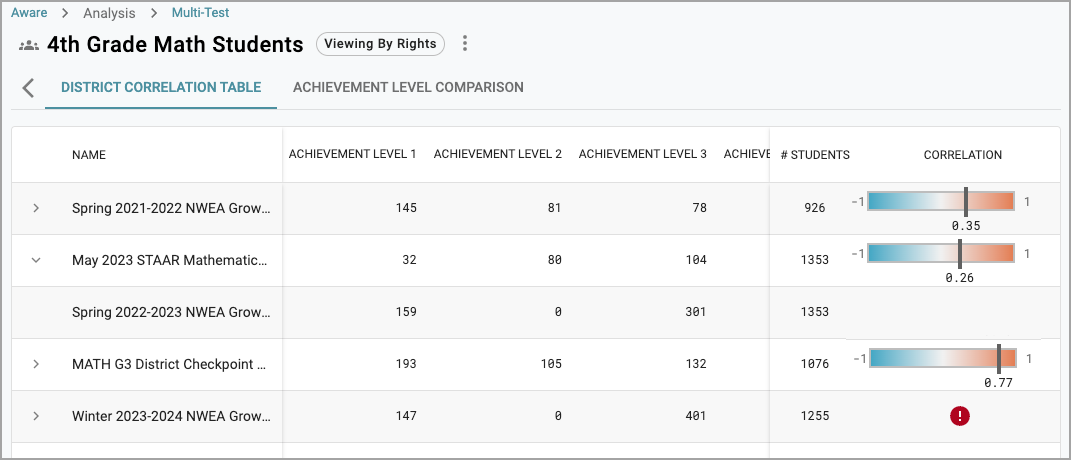
The District Correlation Table shows the number of students in each Achievement Level for each test. Only students who took both the test and the comparative test appear in each row. The test row is expandable to show the comparative test as desired.

Note: Be cautious when interpreting correlation values with assessments that include very few students. Correlation values are typically more reliable when more than 100 students take an assessment.
View the correlation score on a gauge in the far right column. The correlation score describes the linear relationship between the comparative test and the test in the row. Expand or collapse each row to show the comparative test selected for the Correlation View. Every correlation calculation is made with the scores for students that are in common across both tests.
Users may see a red warning icon instead of the correlation score gauge. The warning icon occurs either when all students received the same score on an assessment or when no students took both assessments to calculate the correlation.
Note: A strong correlation does not necessarily imply a meaningful relationship alone. Use the Achievement Level Comparison chart to help determine if the test is valid compared to the comparative test.
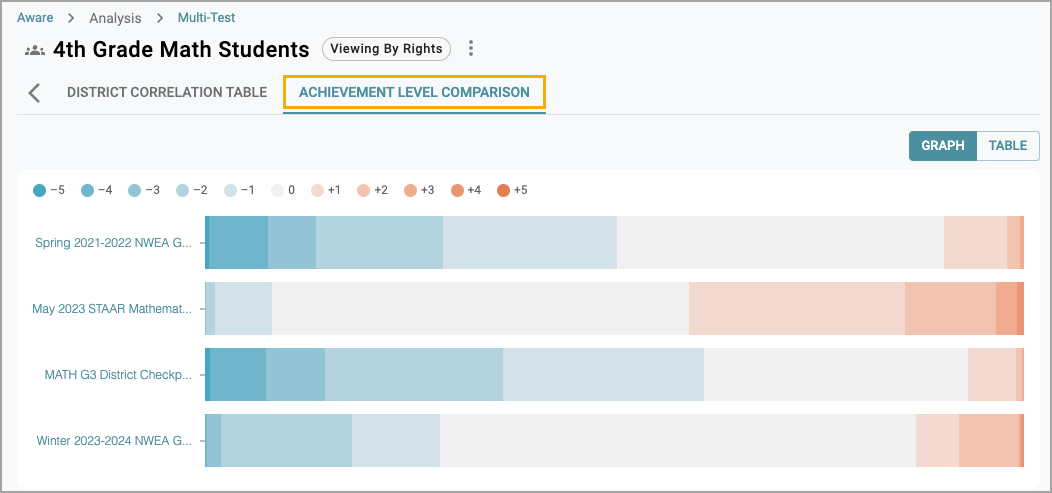
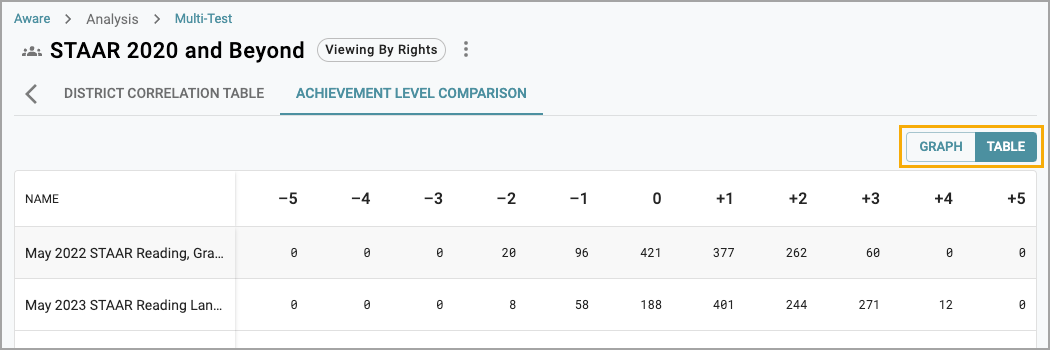
The Achievement Level Comparison chart provides a visual graph and a table showing how students changed in their Achievement Level from the comparative test to each test in the progress profile. The Achievement Level Comparison helps decide if one test was more or less difficult than the comparative test.

Students are sorted by how much their Achievement Levels changed from the comparative test. For example, a student who earned Achievement Level 3 on one test and then Achievement Level 1 on another would show as a -2 in the Achievement Level Comparison chart because they dropped two Achievement Levels. A student who earned Achievement Level 3 on both assessments would show a 0 in the chart because their Achievement Level did not change.
Users can toggle between the Graph view and the Table view of the Achievement Level Comparison chart.

While not universally applicable, if a test shows a cluster of students that increased Achievement Levels and very few that stayed or dropped Achievement Levels, then you might interpret that the test was easier than the comparative test.
Similarly, if many students are clustered to the left, having dropped Achievement Levels, then the test may be more challenging than the comparative test.
Large clusters towards the center may imply that the tests had similar difficulties.
Use caution when analyzing the ease of a test using the Achievement Level Comparison table alone. Many factors play into the difficulty of an assessment. The Achievement Level Comparison is best used as a reference point to decide if further investigation is required.