.png)
The Quintile Analysis Report is available to principals and district data viewers. These reports can be built using STAAR or local assessment data. Teachers can access their own version: the Class Quintile Report.
The Quintile Analysis Report uses individual or aggregate assessment data and distributes students into five equal groups, or quintiles, with an average percent correct displayed for each quintile. Quintile analysis reports help identify performance gaps and which students might need intervention.
Access
Principals can see individual student data and school-wide summary data. This data cannot be filtered to a specific course period/section.
District data viewers can see individual student and district-wide summary data. This data can be filtered to a single school.
Creating a Quintile Analysis Report for Principals or District Data Viewers
Quick Guide
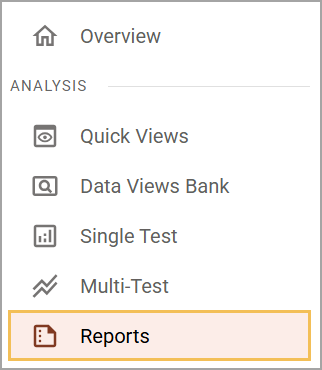
Select Reports () under Analysis in Aware.
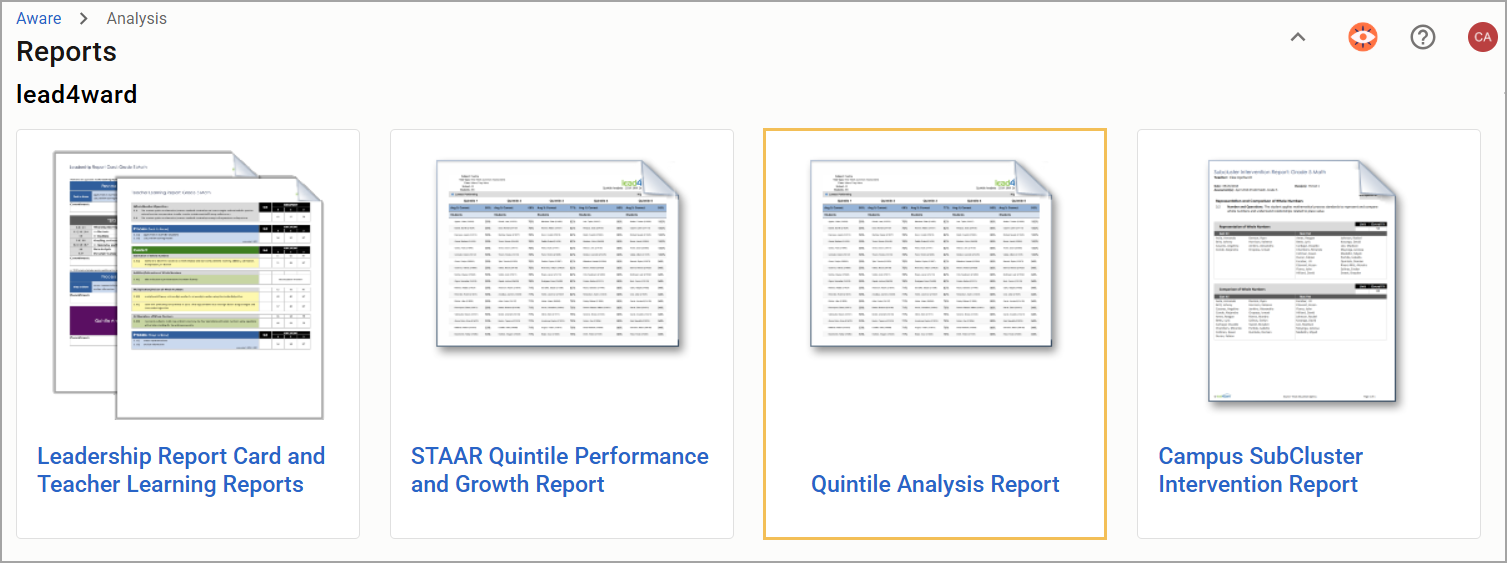
Locate the lead4ward reports and select Quintile Analysis Report.
Choose your assessments by selecting a Grade Level/Subject combination.
Choose STAAR, STAAR Early, or Local to then select how many years to include.
Either enter a school name to include students only from that state, or leave the area blank to include all students.
Choose Where They Were or Where They Are Now. Then, select Next.
Review the list of assessments. Delete and add more as needed.
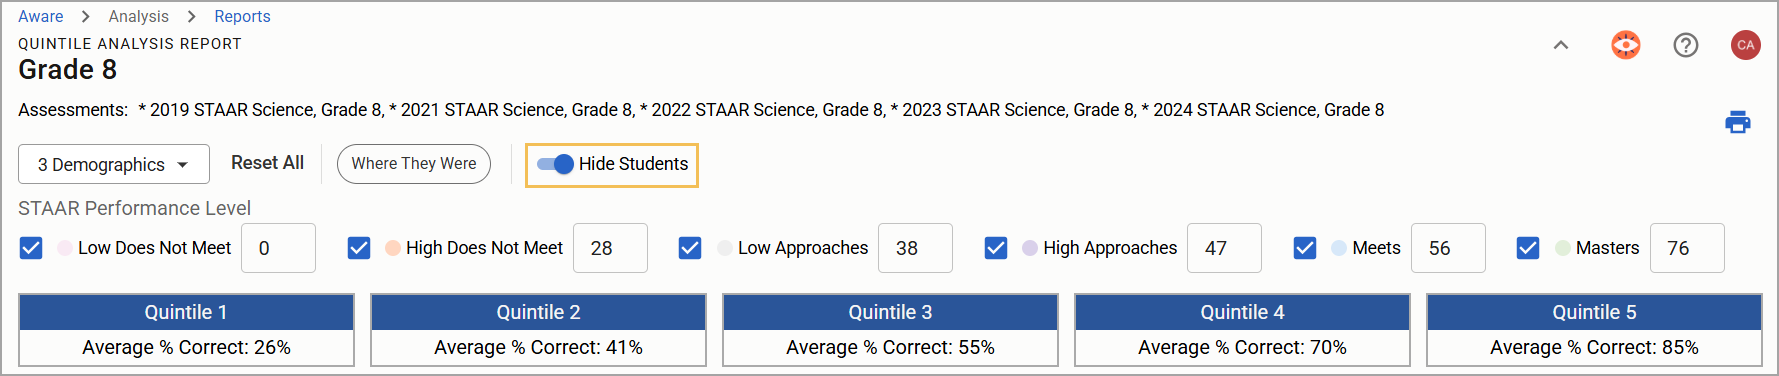
Select Generate Report to open a screen where you can customize the report using interactive features, such as highlighting students in performance categories and setting performance level cut scores.
Select one or more STAAR performance levels or leave all selections blank.
Use the Demographics filter to bold students who match the selected criteria.
Select the Print icon () to create a PDF or physical copy of the report.
Illustrated Guide
Step 1: Select Reports () under Analysis in Aware.
Step 2: Locate the lead4ward reports and select Quintile Analysis Report.
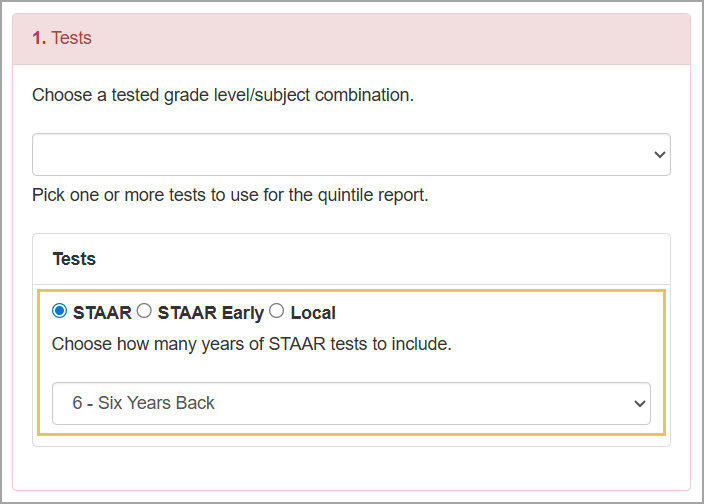
Step 3: Choose your assessments by selecting a Grade Level/Subject combination.
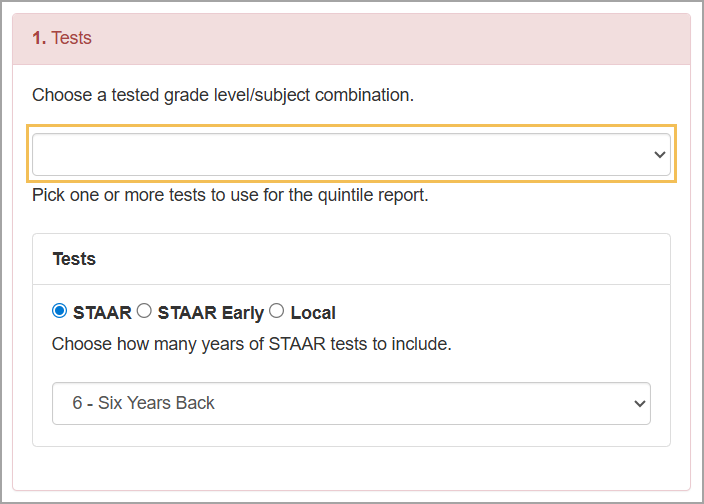
Step 4: Choose STAAR, STAAR Early, or Local to obtain the following analysis:
STAAR – Choose a single year or multiple years aggregated.
STAAR Early – Choose the most recent results or results from two years back.
Local – Choose one or more local test types for the current school year.
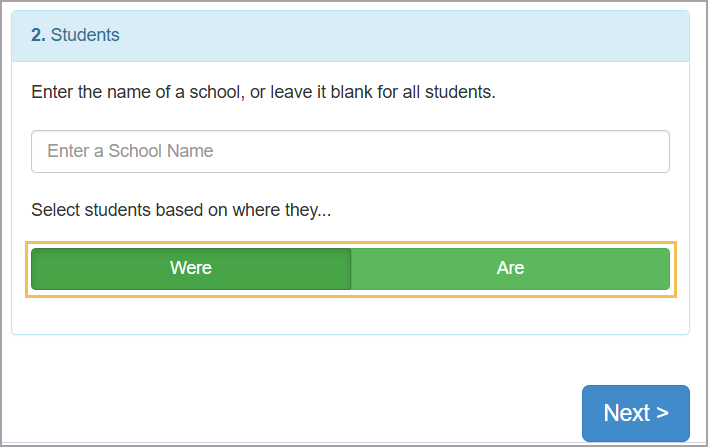
Step 5: Either enter a school name to include students only from that state, or leave the area blank to include all students.
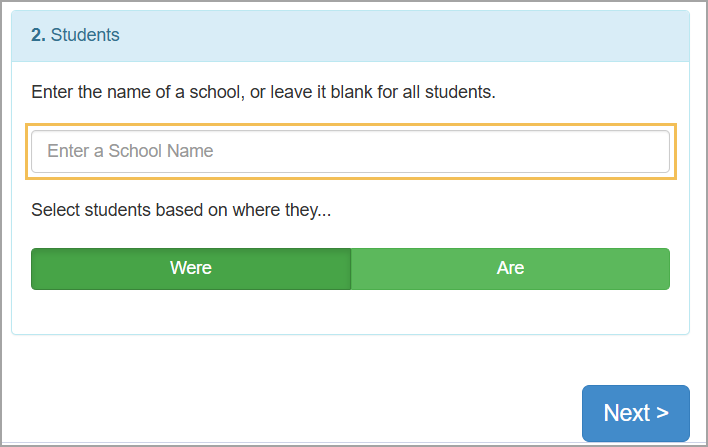
Step 6: Choose Where They Were or Where They Are Now. Then, select Next.
Step 7: Review the list of assessments.
To remove an assessment, click the X icon next to the assessment’s name. To add additional assessments, click the Plus icon in the Selected Tests field.
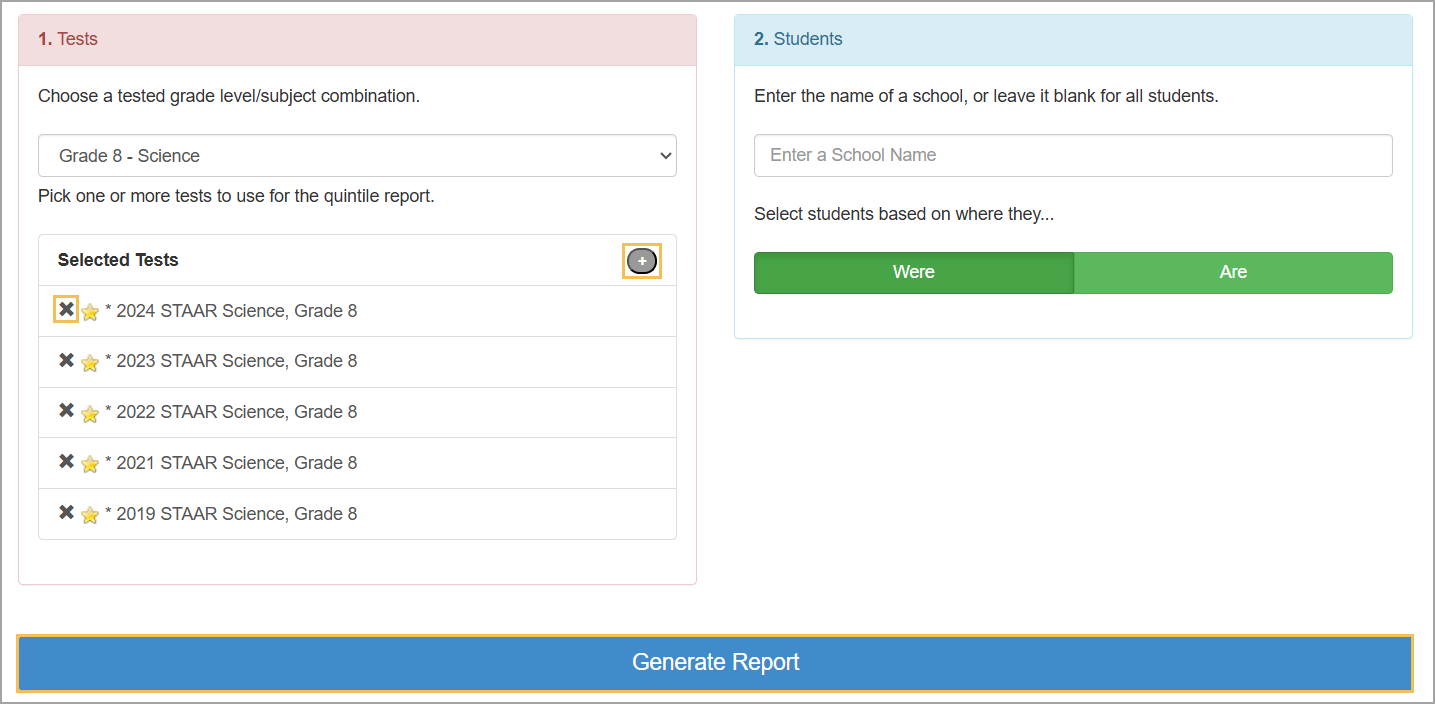
Step 8: Select Generate Report to open a screen where you can customize the report using interactive features, such as highlighting students in performance categories and setting performance level cut scores.
Students are displayed in percent performance order, then alphabetically by last name.
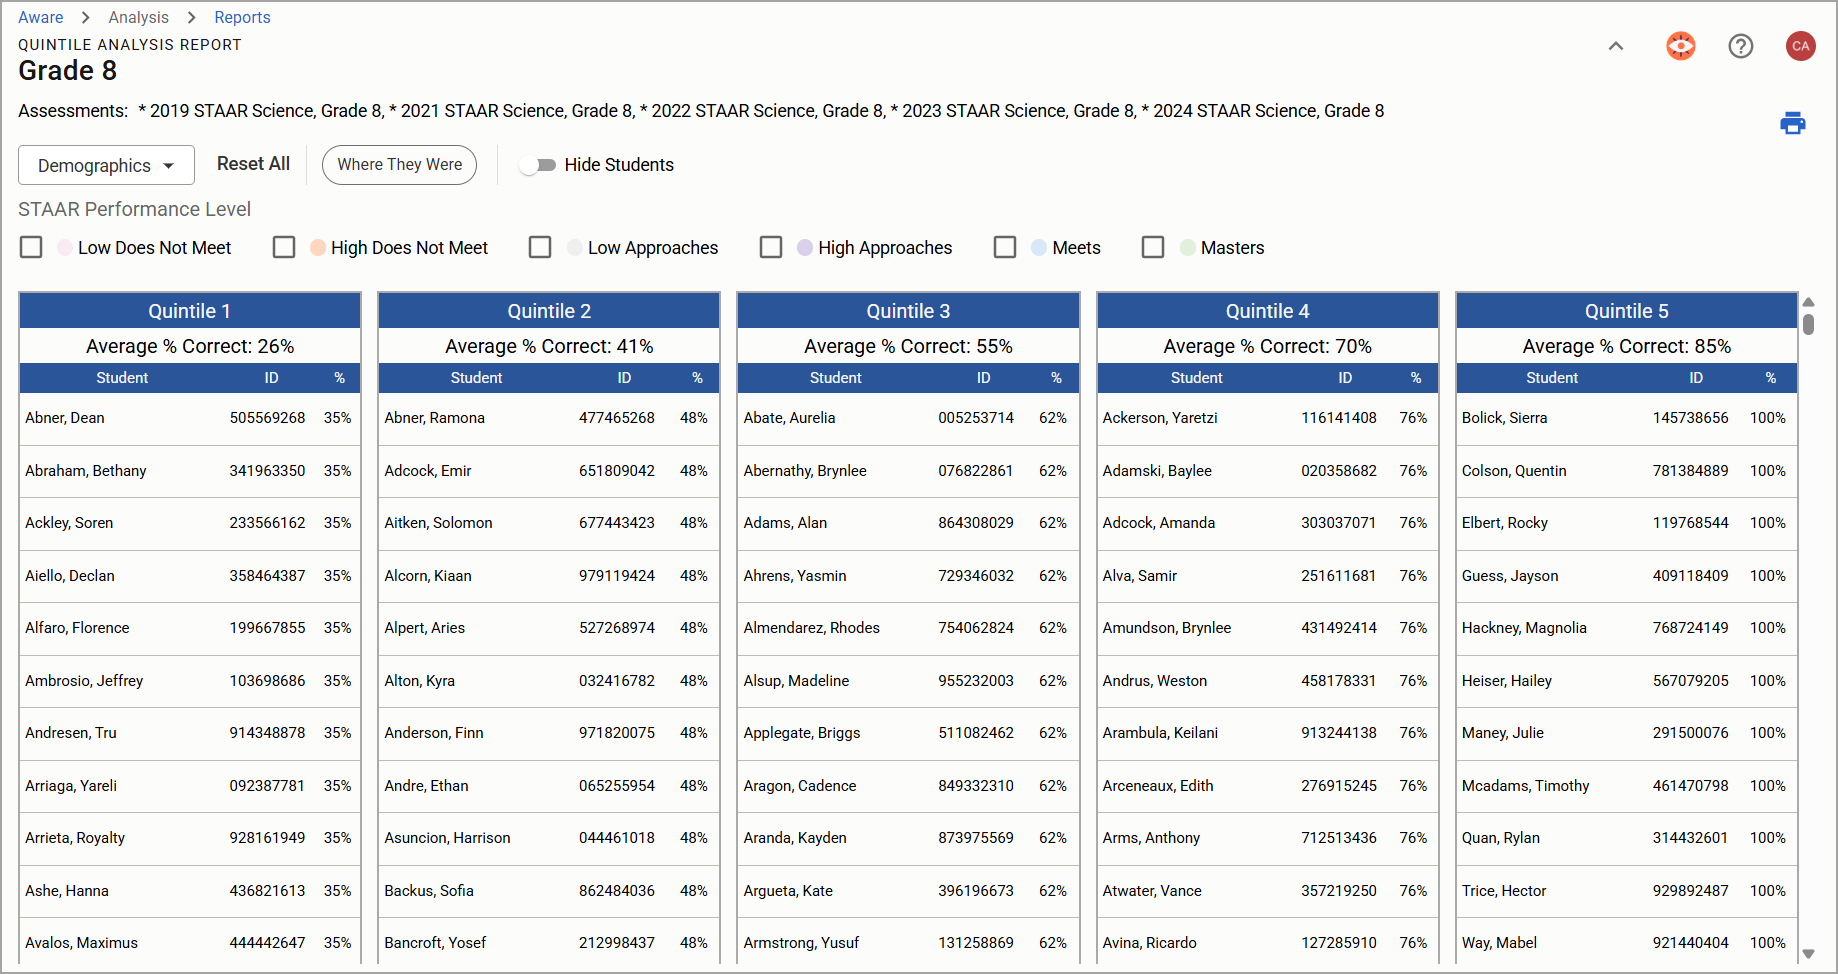
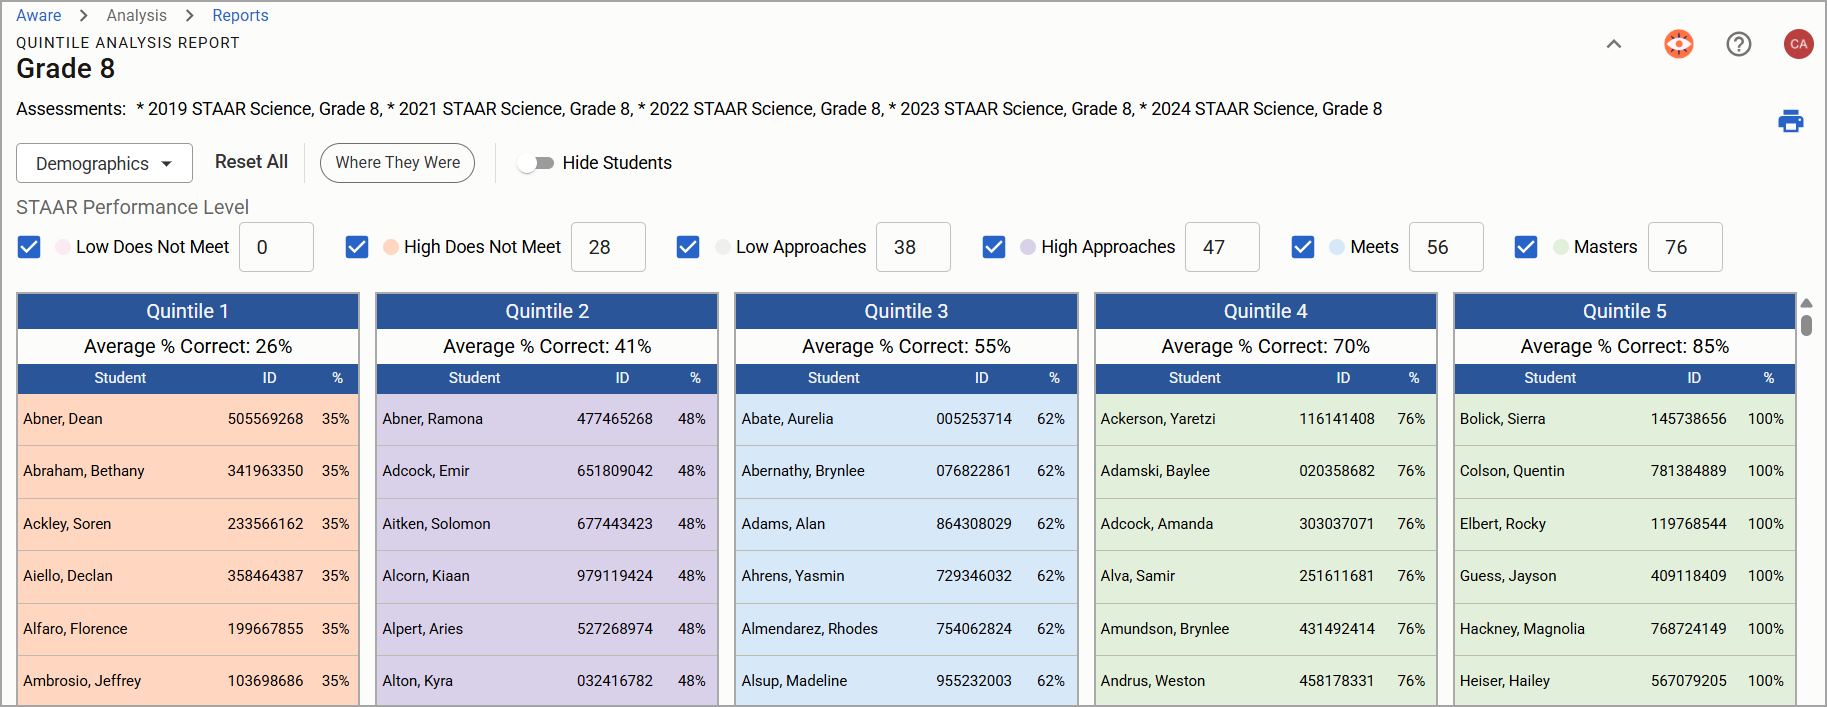
Step 9: Select one or more of the following STAAR performance levels or leave all selections blank:
Low Does Not Meet
High Does Not Meet
Low Approaches
High Approaches
Meets
Masters
Checking the box beside each level highlights the students included in that level in the designated color. While the colors are not customizable, users can edit the default cut scores as needed.
Note: Each performance level defaults to a number based on a 3-year average of cut scores for that grade level and subject’s STAAR from 2023, 2024, and 2025. Default cut scores for non-STAAR-tested areas are based on the overall average of all cut scores.
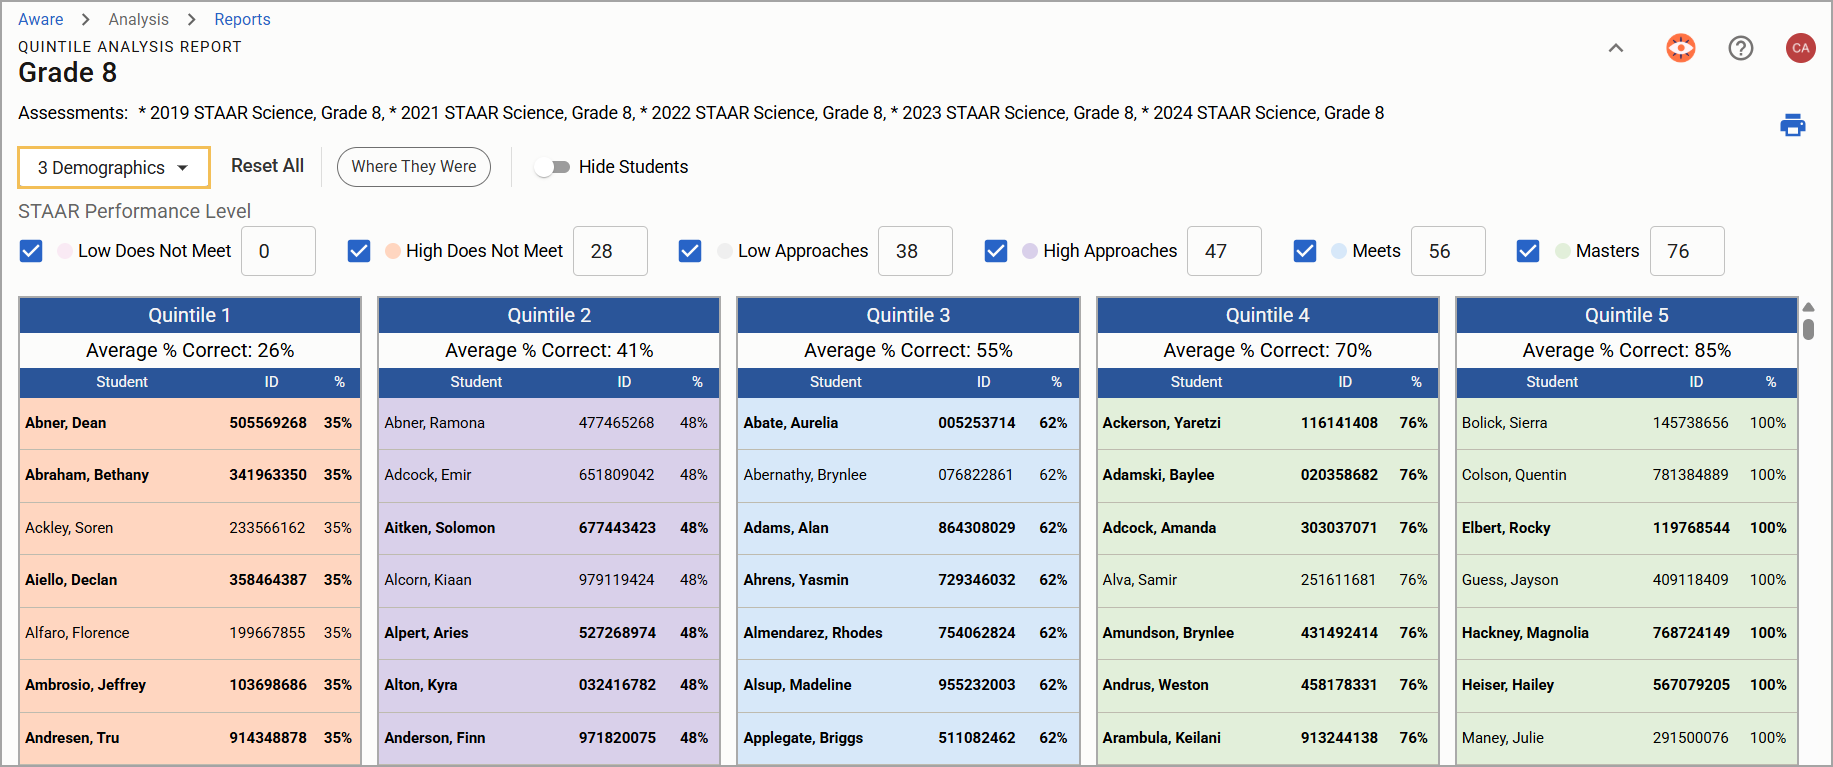
Step 10: Use the Demographics filter to bold students who match selections from the following criteria:
Grade Level
Student Identifier
Ethnicity
ESL
Emergent Bilingual
RTI
Title 1 Part 1
Career and Technology Ed
Schools
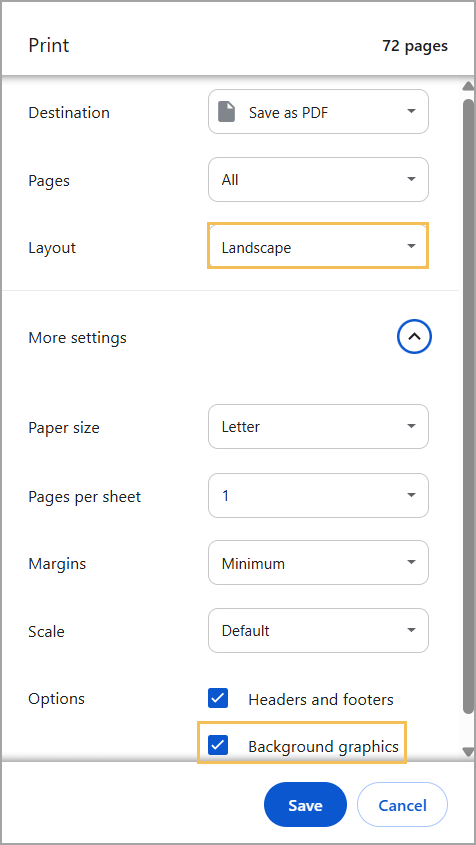
Step 11: Select the Print icon () to create a PDF or physical copy of the report. For best results, change the layout to Landscape, and under More Settings, check the box for Background graphics.
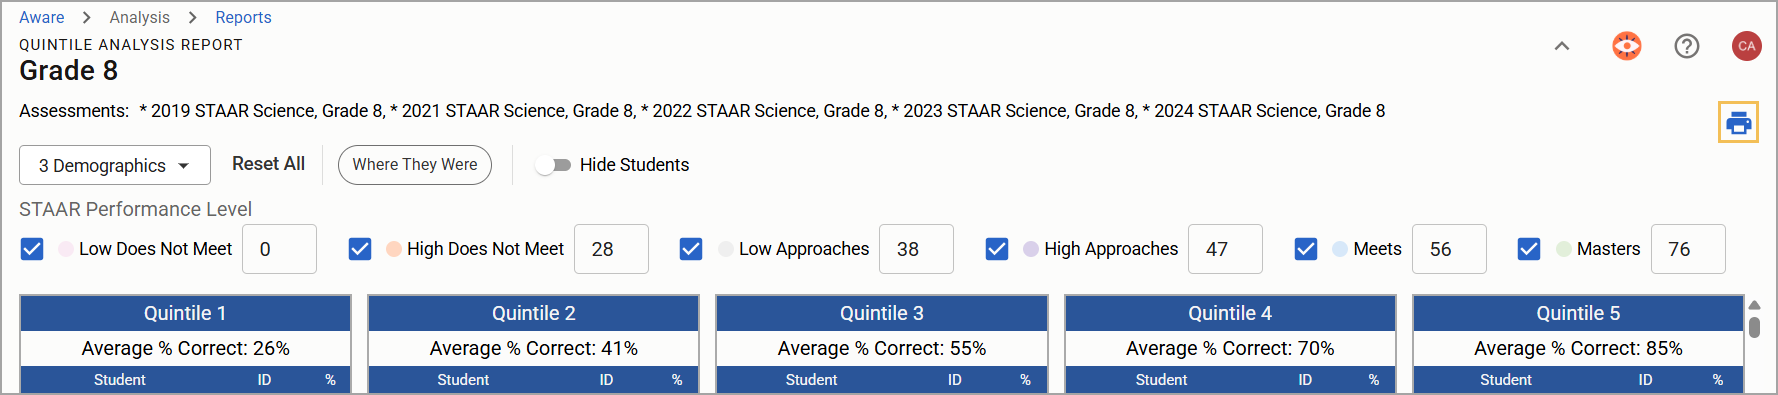
To print a Quintile Analysis Report without student names, toggle on Hide Students.