To create an interactive response question, begin by creating a new test in Aware or open an existing test to add new questions.
Note: Assessments with interactive response questions can be printed as test booklets only. Answer documents are not available for these question types. This test is not scannable, nor will it have student IDs, class numbers, or any other information. Teachers must use the Enter Answers feature to manually input student responses for students taking a paper version of the assessment.
Creating a Charting Question
In charting questions, students create a bar chart with the information given. TEA suggests charting for use in math assessments, but charting is available for any assessment.
Quick Guide
When working on an assessment, go to the Questions tab and do the following:
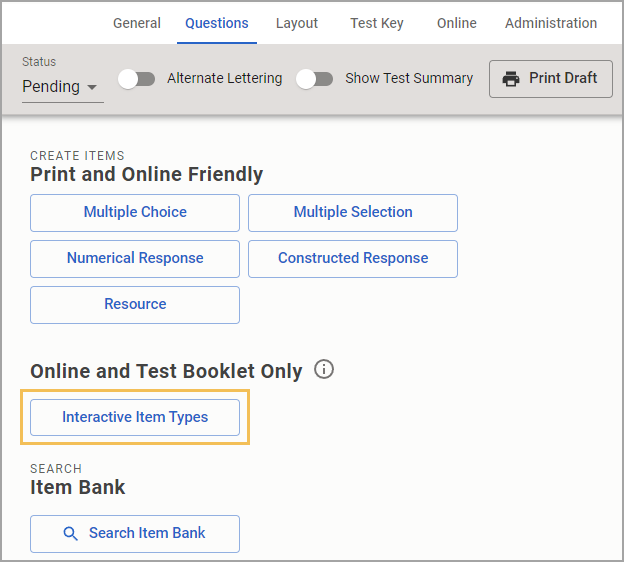
If this is the first time adding a question, select the Interactive Item Types button.
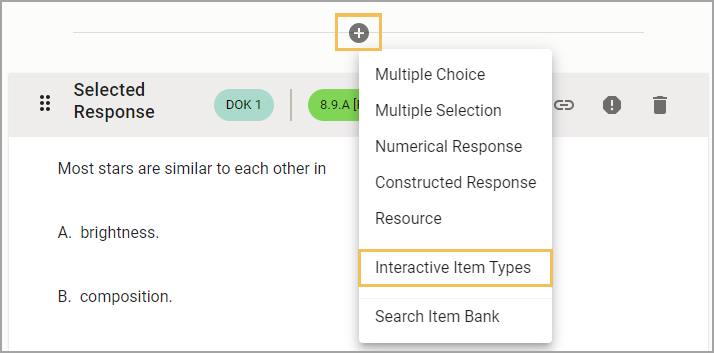
If adding more questions, select the Plus sign and choose Interactive Item Types from the drop-down menu.
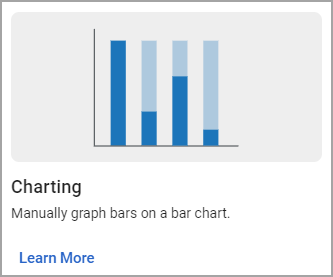
Select Charting.
Use the text box and controls to enter the charting prompt.
Select Continue.
Use the settings to configure the chart.
When complete, select Create / Update.
Illustrated Guide
Step 1: When creating or editing an assessment in Aware, navigate to the Questions tab and do the following:
If this is the first time adding a question to the assessment, select the Interactive Item Types button.
If you want to add more questions to an existing assessment, select the Plus sign above or below an existing question and choose Interactive Item Types from the drop-down menu.
Step 2: On the Choose your interaction type step, select Charting from the available question types.
Step 3: On the Construct your question step, use the text box and controls to enter a prompt for the charting question.
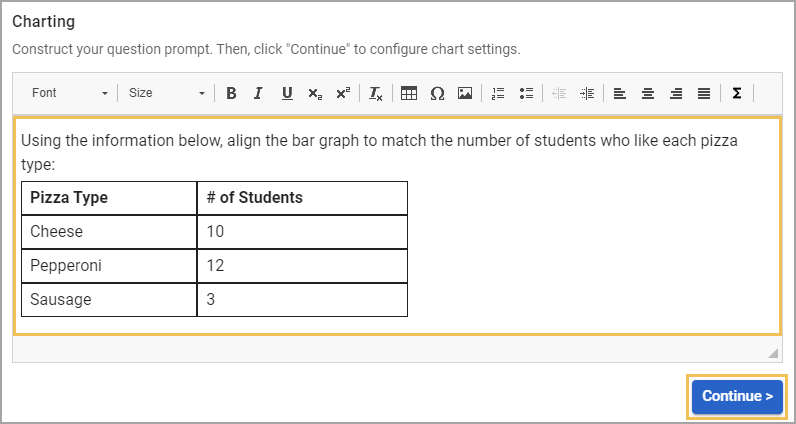
Step 4: Review the prompt and select Continue to move on to the next step.
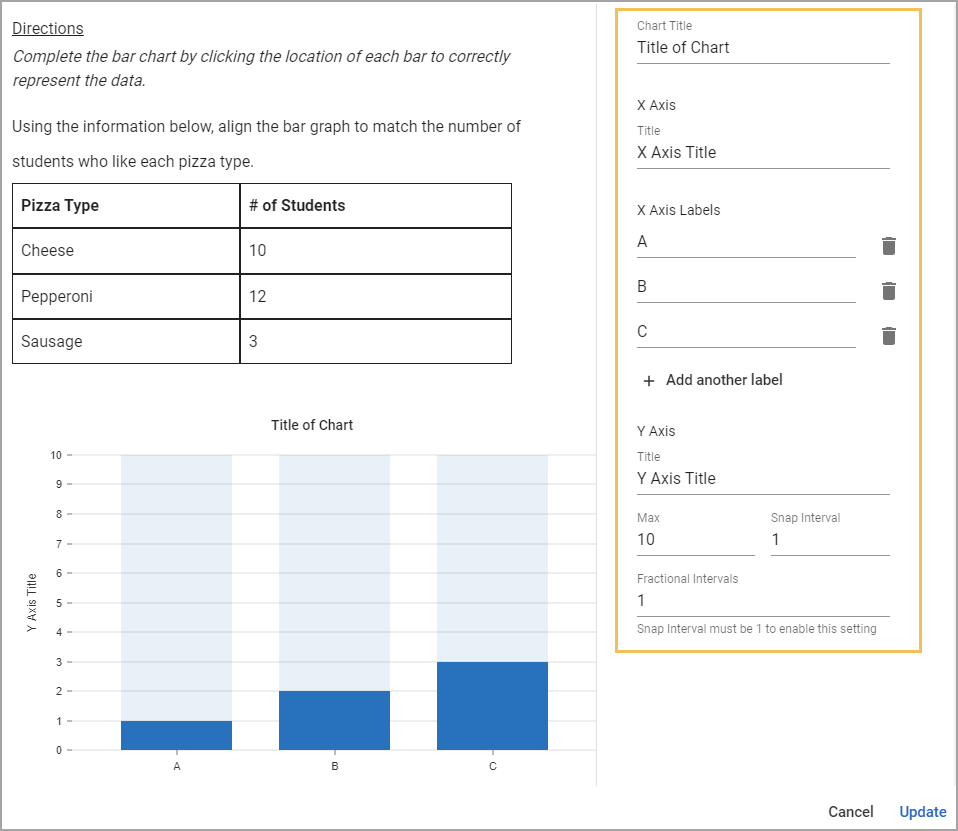
Step 5: On the Add interactions to the question step, configure the chart using the settings.
The chart can contain up to five bars. Set the Max for the Y Axis. The Y Axis intervals will change depending on what you set as the Max. For instance, a Max value between 1-25 will show an interval of 1 between numbers. A Max value between 26-56 will show an interval of 2 between numbers, 57-127 will show an interval of 5, etc.
The Snap Interval setting uses whole numbers and will determine where the bar snaps as students interact. To set the correct answers, drag the bars to the appropriate height.
The chart can also be operated using the keyboard. Select Add interactions to the question, then press the Tab key to select the first bar of the chart. The up and down arrow keys will adjust the value of the bar, and the left and right arrow keys will select the adjacent bar. Students can also utilize the arrow keys to answer the question. Zeroes and negative numbers are not allowed as answers.
Step 6: Review the preview and then select Create or Update to save the assessment question.
Using Fractional Intervals
Test creators can use the Fractional Intervals setting to create charts displaying basic fractions. Snap Interval must be 1 to enable this setting. It is recommended that Max also be set to 1 to keep questions and answers simple.
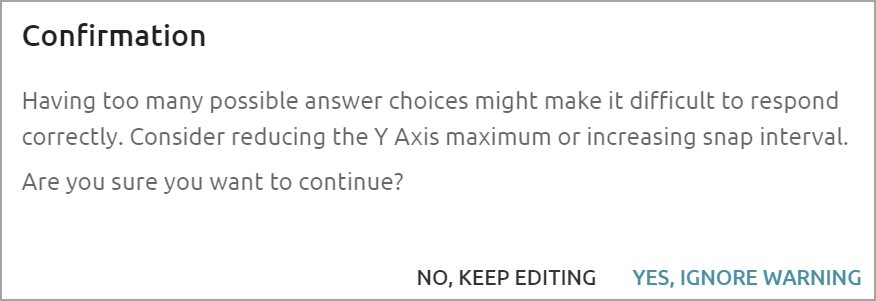
Best Practice: Use Max and Snap Interval to limit the chart's response range to a reasonable, available height. Students may not be able to answer correctly if there are too many choices in a small amount of space. When selecting Create, a warning appears if the recommended range has been exceeded.
Student Experience
Students see the charting question during testing.
Data Analysis
Viewing Responses in Quick Views
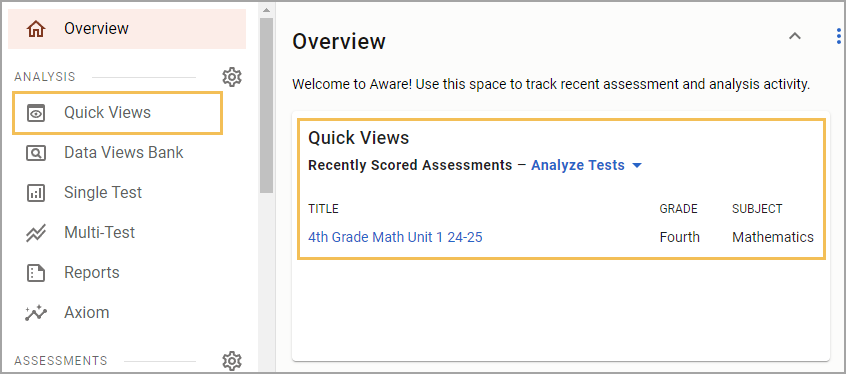
Question Type is available in Quick Views. Access Quick Views through the navigation bar or through the Quick Views card.
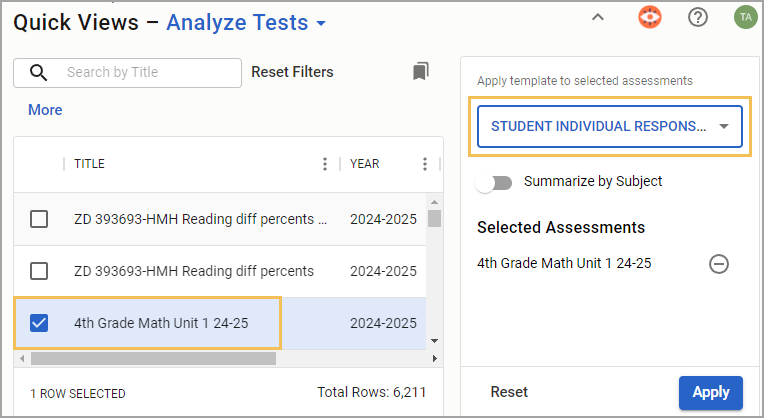
Once in Quick Views, use the search field to find and select the assessment(s) you want to analyze. Choose the Student Individual Responses template from the drop-down menu. Select Apply to continue.
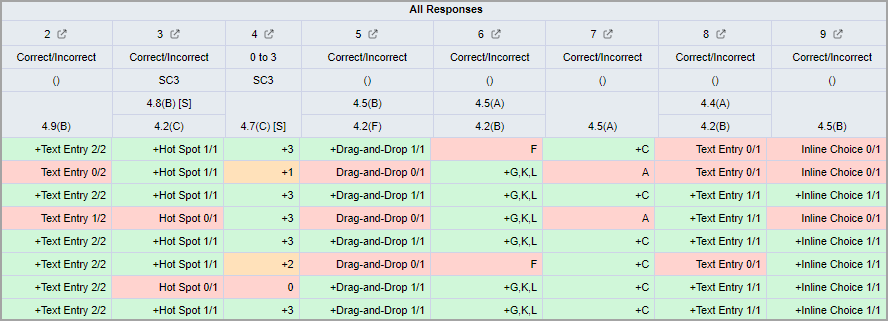
In data analysis, interactive items will be indicated next to the scores for each question. Teachers can view the exact question asked on the Enter Answers screen and modify student answers if needed.
Show or Hide the Question Type Column
If the table does not display the type of question, you can customize which columns appear or do not appear from the Edit menu. Select the Columns tab, and then expand the Responses folder. Drag the Question Type option to the empty space on the right side of the screen. Then, select Update to apply your changes. For more information, see Editing Data Views as a Teacher.
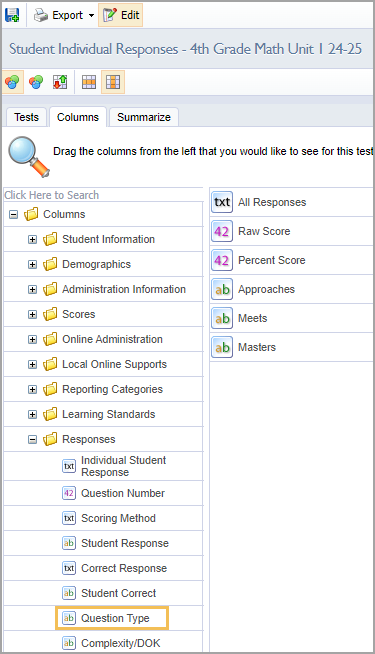
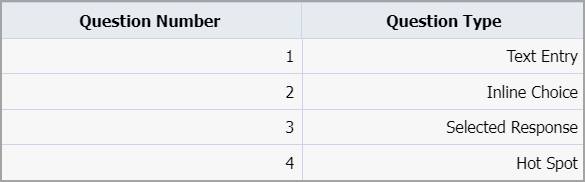
The Question Type column shows the type of question asked and the corresponding question number.
Allowing Teachers to Answer and Score Assessment Questions
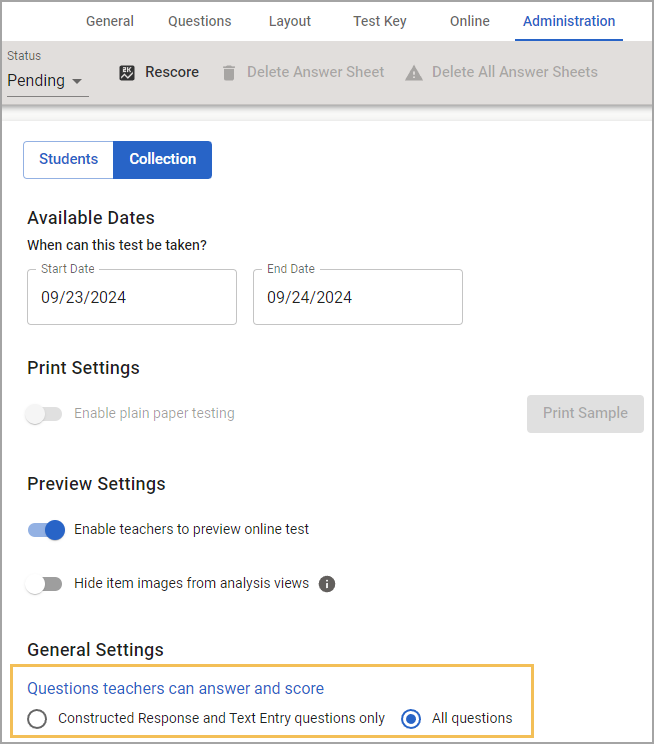
For district- and school-level tests, the Questions teachers can answer and score option must be set to All Questions to enable editing privileges. Locate this setting in Administration > Collection > General Settings when authoring or editing an assessment in Aware.
Additional Information
Visit the Interactive Item Types FAQ for more information.