To create an interactive response question, begin by creating a new test in Aware or open an existing test to add new questions.
Note: Assessments with interactive response questions may be printed as test booklets only. Answer documents are not available for these question types. This test is not scannable, nor will it have student IDs, class numbers, or any other information. Teachers must use the Enter Answers feature to manually input student responses for students taking a paper version of the assessment.
Creating an Intermediate Graphing Question
TEA suggests intermediate graphing for use in math assessments, but intermediate graphing is available for any assessment.
Quick Guide
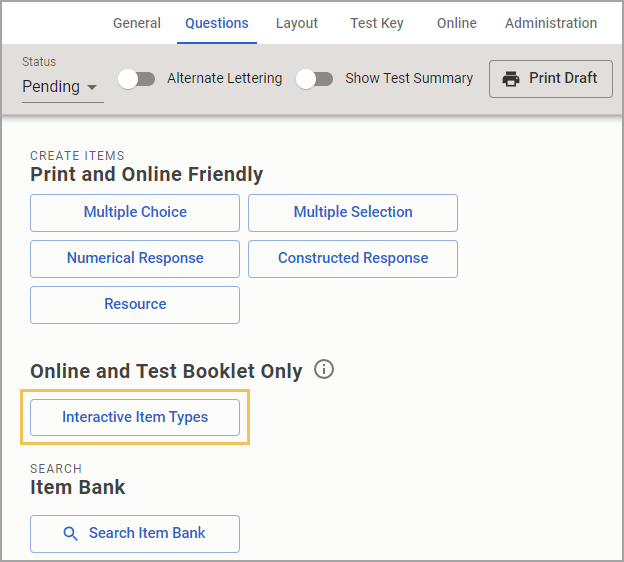
When working on an assessment, go to the Questions tab and do the following:
If this is the first time adding a question, select the Interactive Item Types button.
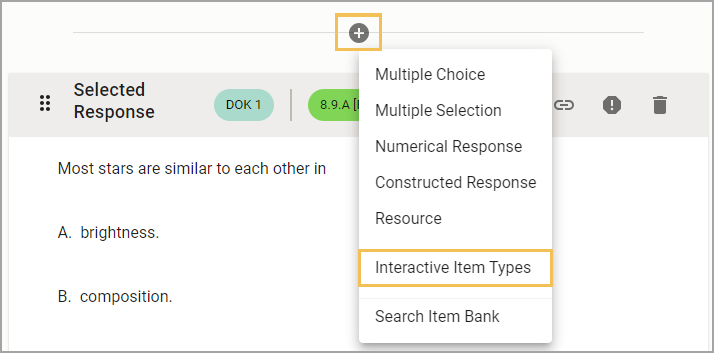
If adding more questions, select the Plus sign and choose Interactive Item Types from the drop-down menu.
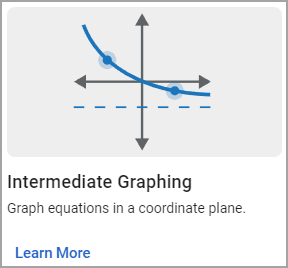
Select Intermediate Graphing.
Use the text box and controls to enter the question prompt.
Select Continue.
Enable function types for the question by selecting the check box for each type.
Set a range for the X and Y axes.
When complete, select Create / Update.
Illustrated Guide
Step 1: When creating or editing an assessment in Aware, navigate to the Questions tab and do the following:
If this is the first time adding a question to the assessment, select the Interactive Item Types button.
If you want to add more questions to an existing assessment, select the Plus sign above or below an existing question and choose Interactive Item Types from the drop-down menu.
Step 2: On the Choose your interaction type step, select Intermediate Graphing from the available question types.
Step 3: On the Construct your question step, use the text box and controls to enter the prompt for the question.
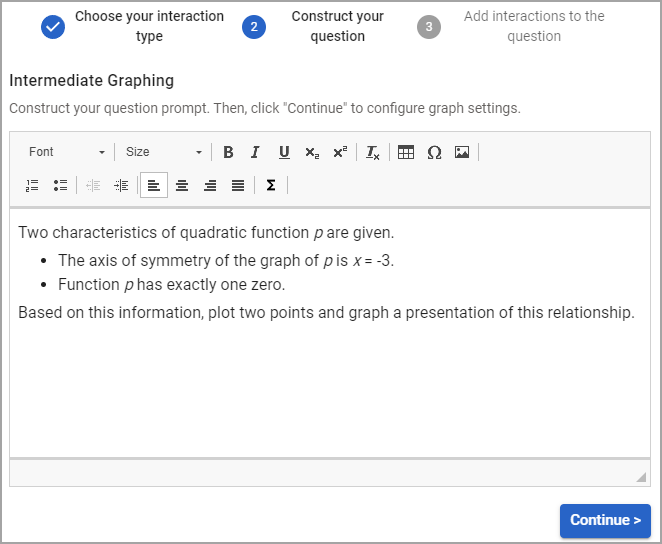
Step 4: Select the Continue button to move on to the next step.
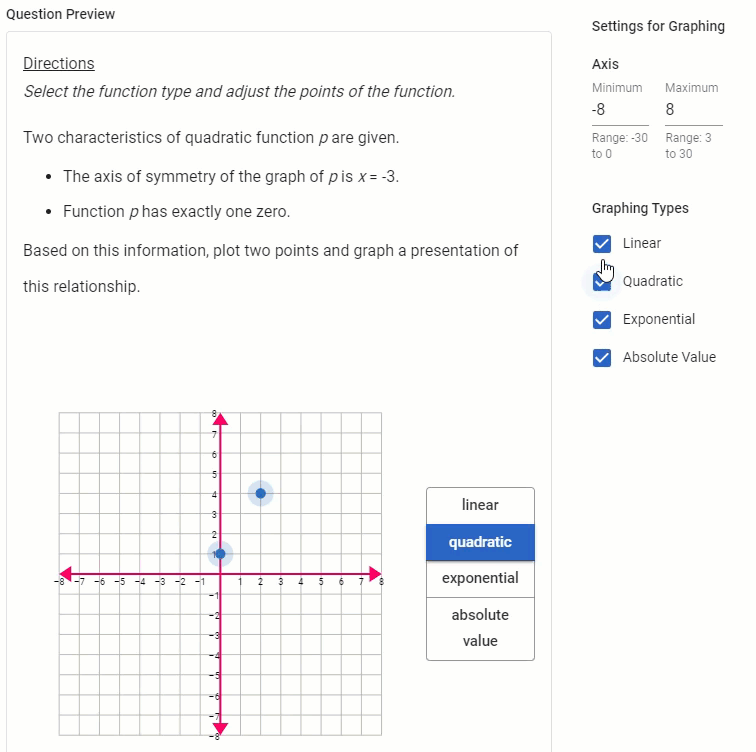
Step 5: Select the equation type appropriate for the prompt. The intermediate graph allows for the graphical representation of four function types.
Linear - straight line
Quadratic - parabola
Exponential - growth curve
Absolute Value - vertex
Enable function types for the question by selecting the check box for each type.
Default directions automatically adjust for students depending on how many function types are enabled.
One Function Type Enabled - Adjust the points of the function.
Two or More Function Types Enabled - Select the function type and adjust the points of the function.
Step 6: Set a range for the X and Y axes.
Set the Axis Minimum to a range between -30 and 0. Set the Axis Maximum to a range between 3 and 30. If minimum and maximum numbers conflict with each other, a graph will not appear until you set a suitable range.
To set the answer, click on each dot and drag it to the correct points on the graph.
Keyboard operation of the intermediate graph is also possible, but the dots must be plotted somewhere on the graph first in order to be selected. Once there are plotted dots, select Add interactions to the question, then press the Tab key to select the nearest dot. The dot can be moved along both axes using the directional arrow keys. When ready, press the Tab key to select the next dot.
Step 7: Review the preview and then select Create or Update to save the assessment question.
Student Experience
Students see the intermediate graphing question during testing. 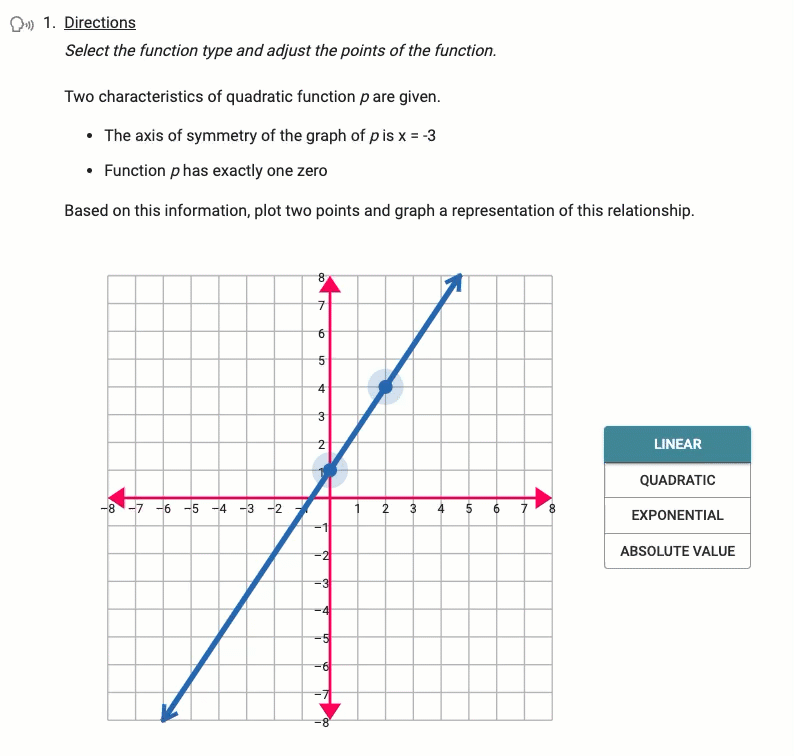
Scoring
Aware offers one type of scoring for intermediate graphing: correct/incorrect. You can adjust scoring options when creating assessments and learn how Selecting Scoring Rules for Assessments aligns with STAAR redesign options for math assessments.
Data Analysis
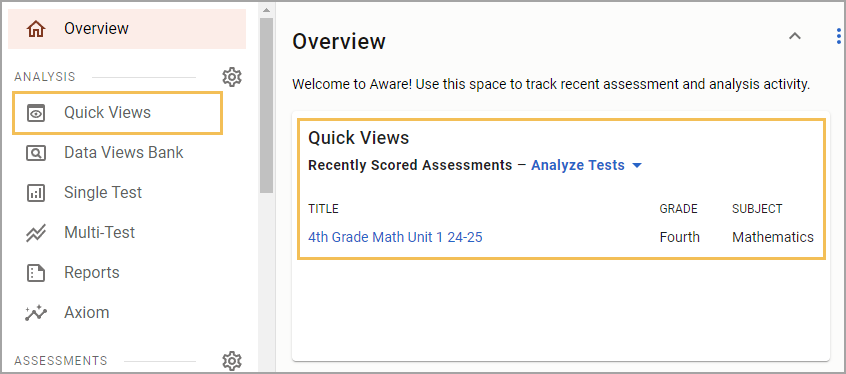
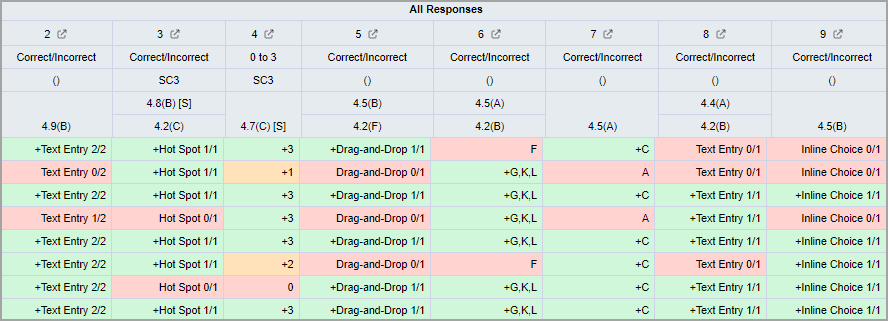
Viewing Responses in Quick Views
Question Type is available in Quick Views. Access Quick Views through the navigation bar or through the Quick Views card.
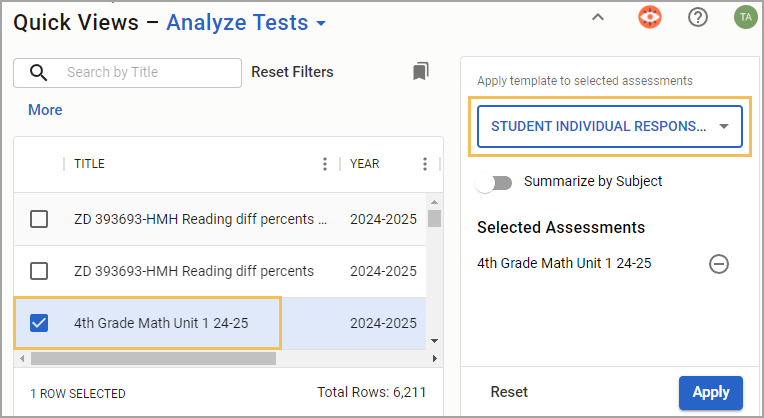
Once in Quick Views, use the search field to find and select the assessment(s) you want to analyze. Choose the Student Individual Responses template from the drop-down menu. Select Apply to continue.
In data analysis, interactive items will be indicated next to the scores for each question. Teachers can view the exact question asked on the Enter Answers screen and modify student answers if needed.
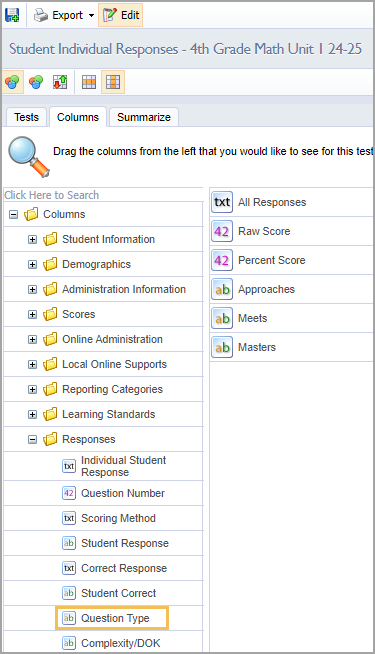
Show or Hide the Question Type Column
If the table does not display the type of question, you can customize which columns appear or do not appear from the Edit menu. Select the Columns tab, and then expand the Responses folder. Drag the Question Type option to the empty space on the right side of the screen. Then, select Update to apply your changes. For more information, see Editing Data Views as a Teacher.
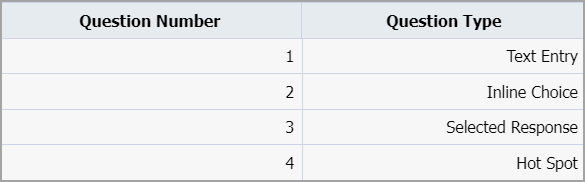
The Question Type column shows the type of question asked and the corresponding question number.
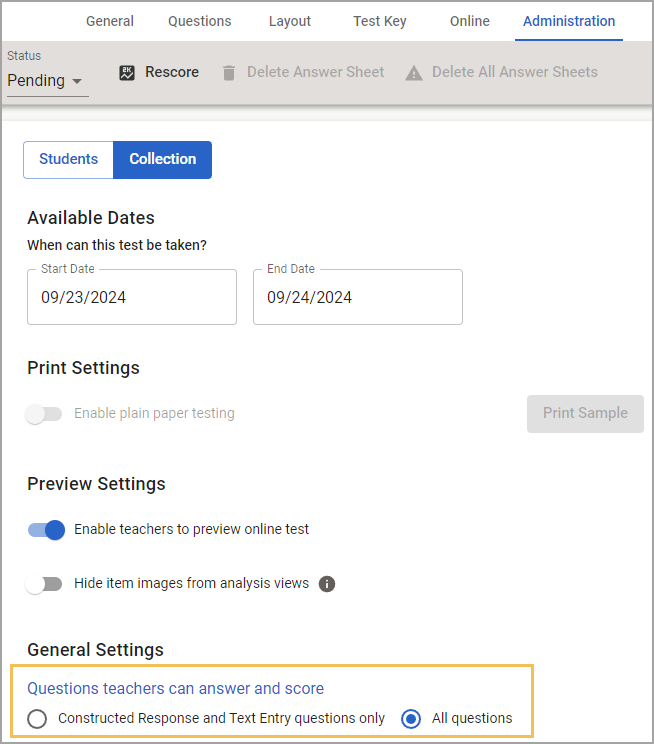
Allowing Teachers to Answer and Score Assessment Questions
For district- and school-level tests, the Questions teachers can answer and score option must be set to All Questions to enable editing privileges. Locate this setting in Administration > Collection > General Settings when authoring or editing an assessment in Aware.
Additional Information
Visit the Interactive Item Types FAQ for more information.