Eduphoria is excited to provide an amazing accountability tool, Axiom. Use this article, our Axiom FAQ, and Region 10's Axiom Users Site to get started and learn more about this feature.
For pricing information or to add Axiom to Aware, contact sales@eduphoria.net. Contact your district Eduphoria Manager to find out whether Axiom is a feature your district has purchased.
District-level users with the Analyze Accountability Data right for all schools can harness Axiom’s various features with an active license.
Grant Accountability Access
Two levels exist for granting accountability access: assigning the specific right and determining Axiom reporting access for school leaders.
Assign the Analyze Accountability Data Right
Within Management, a system administrator can assign the Analyze Accountability Data right in Aware to any district-level user who manages accountability data. Be sure there is a green check mark next to the right to grant the user access to all schools within their district.
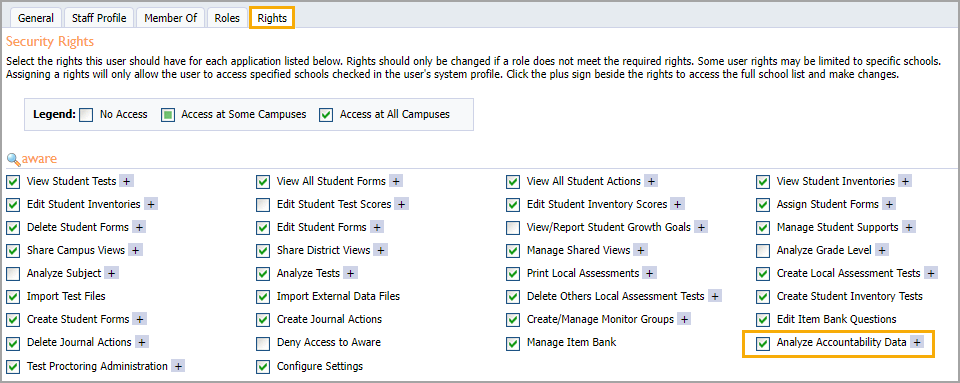
The Analyze Accountability Data right is associated with the Principal role and automatically allows users to view accountability data on the Axiom screen for their assigned school(s).
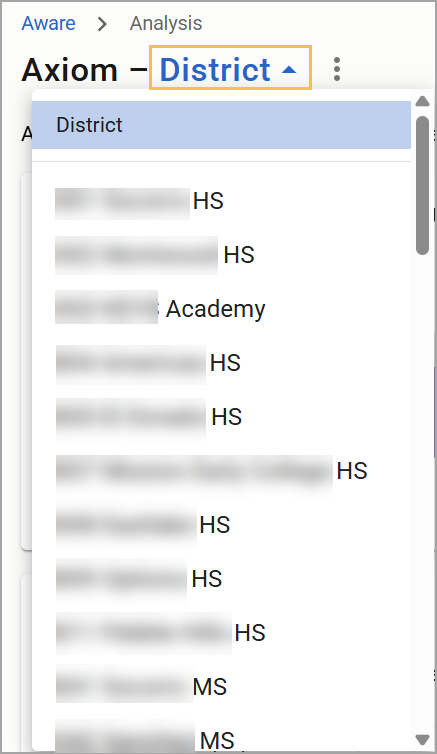
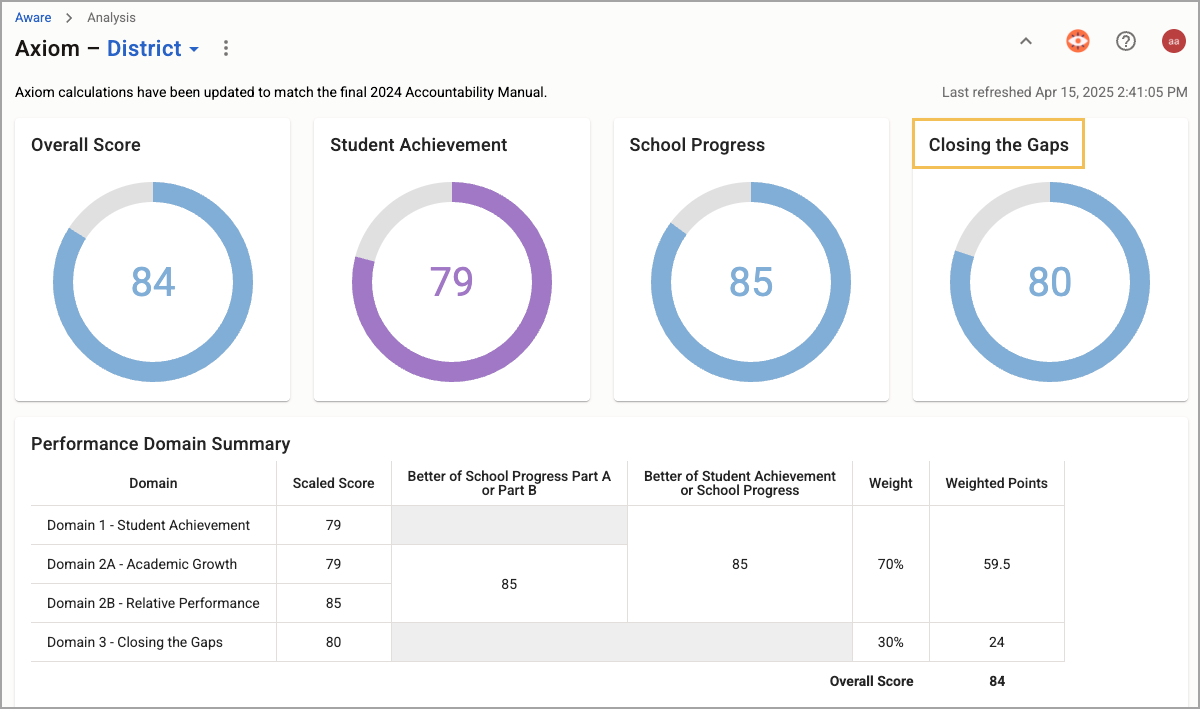
Calculations for the entire district are displayed by default.
.png)
To change to a specific school, select the District drop-down arrow and select a school from the list. A school’s view displays calculations for that school only.
Hide and Show Axiom Reporting From School Leaders
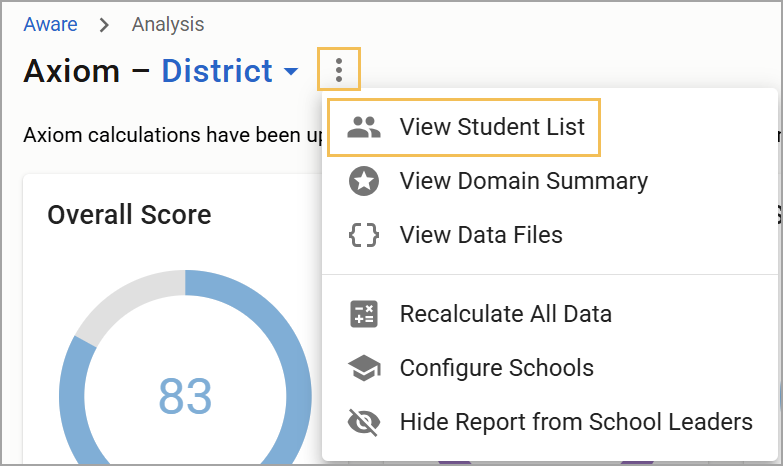
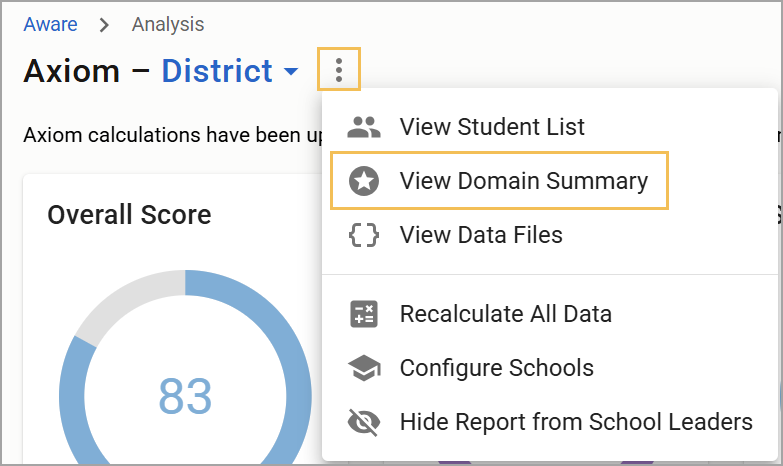
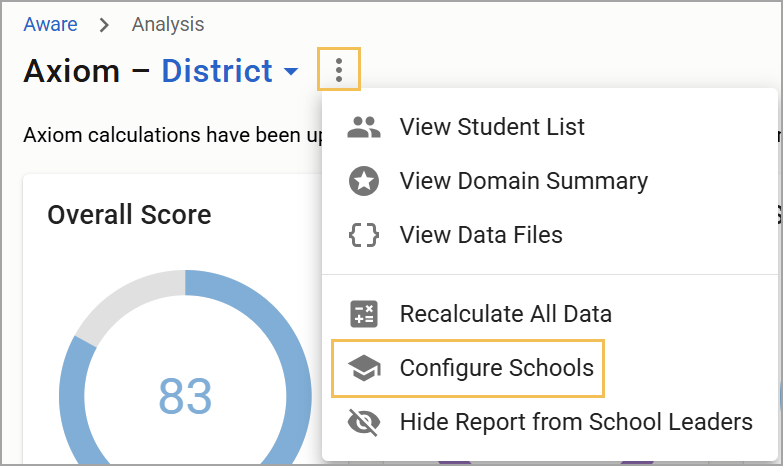
A district-level user can select the three vertical dots () from the Axiom home screen, then select Hide Report from School Leaders () to prevent school leaders, such as principals, from seeing the Axiom screen.
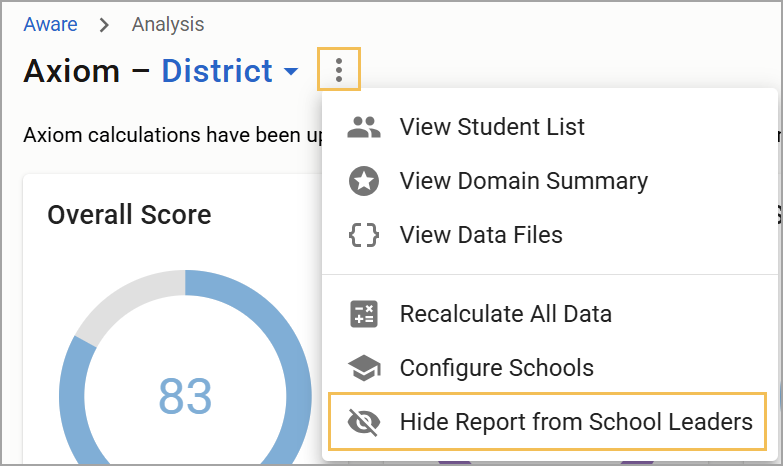
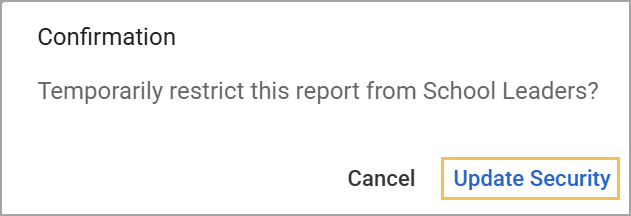
Select Update Security on the confirmation window to complete the change.
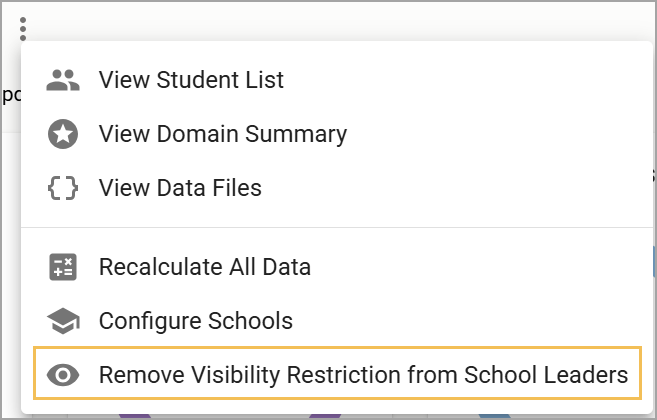
To allow school leaders to view the Axiom screen, select the three vertical dots () again and then select Remove Visibility Restriction from School Leaders (). Then, confirm you want to update security to finalize the change.
View Student List
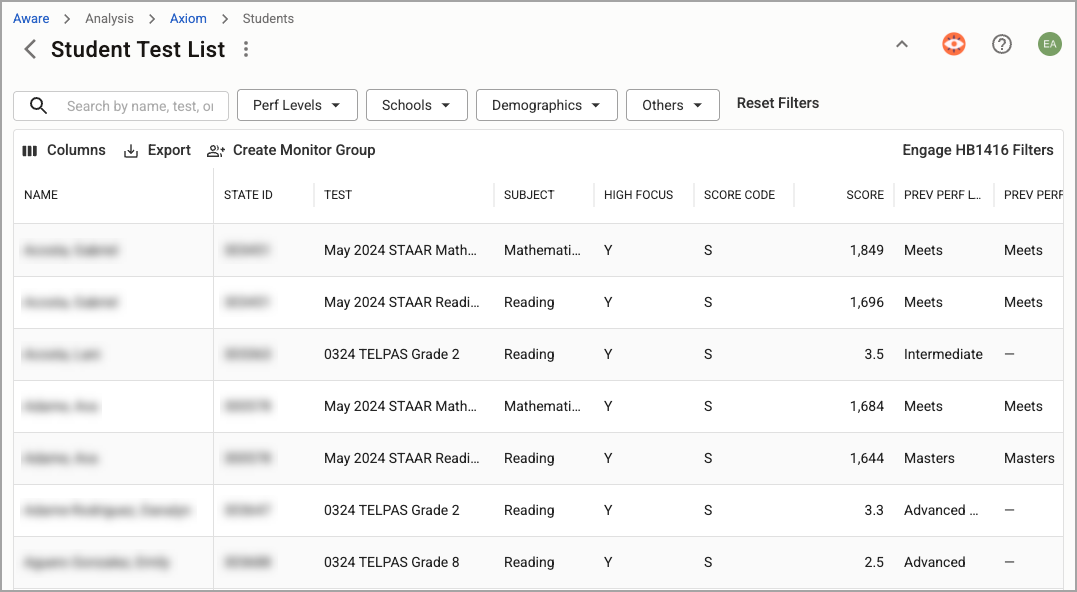
Using the three vertical dots (), select View Student List () to open a table view of students either from an entire district or within a specific school.
Engage various filters to create a more targeted list to view specific data. Once you’ve set your desired filters, select Create Monitor Group () to build a district-level, school-level, or personal Monitor Group in Aware. See Filtering Student Domain 1 Data for Monitor Groups for more information.
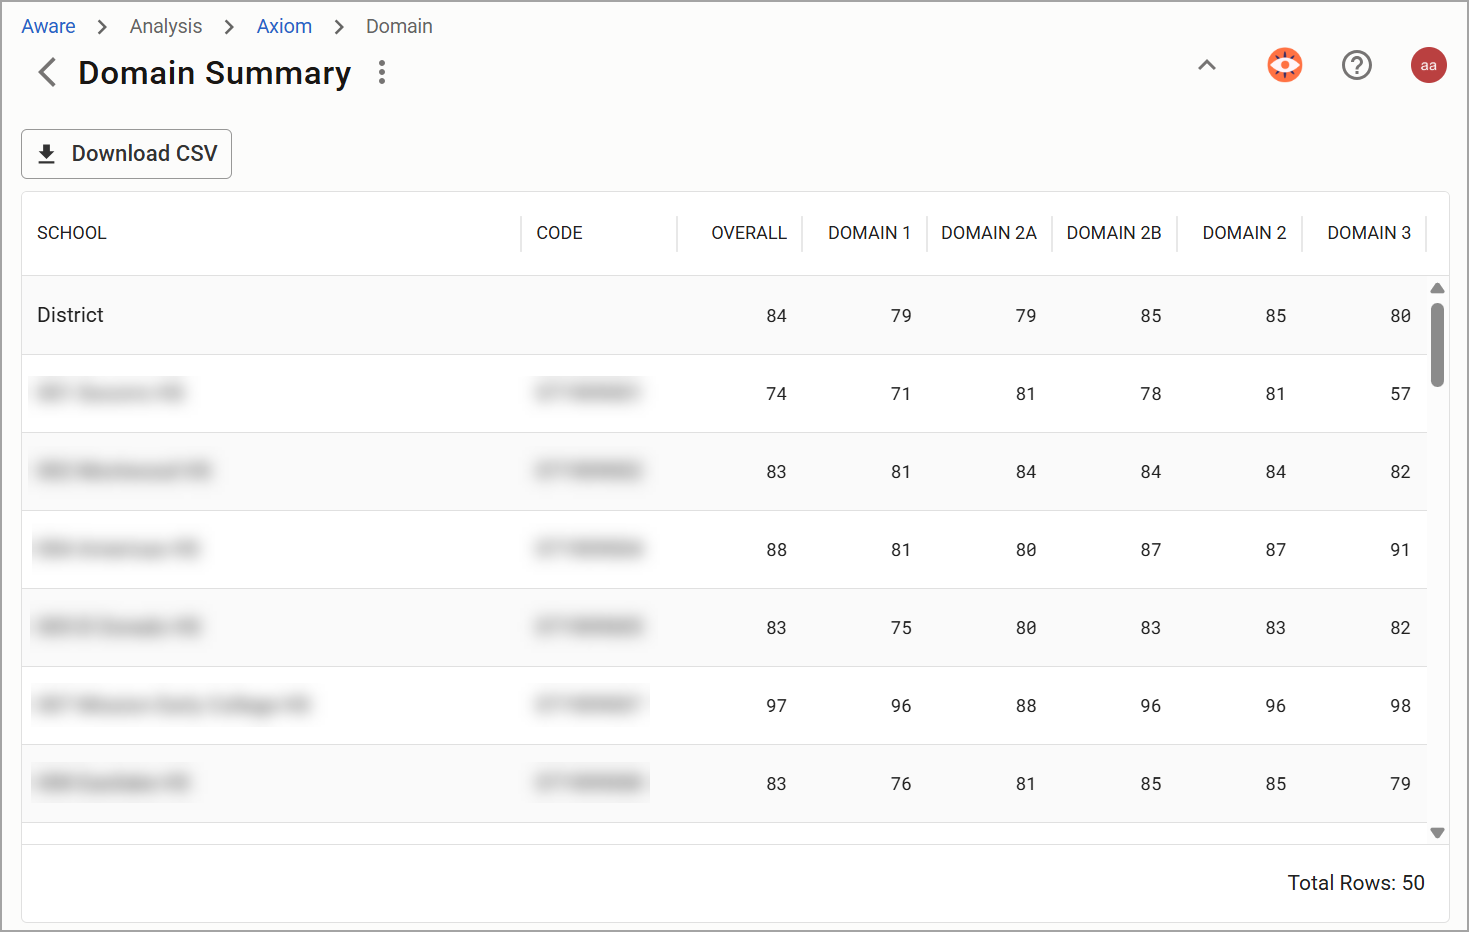
View Domain Summary
Select View Domain Summary () from the three vertical dots () to open a table summarizing district and individual school domain data.
The Domain Summary view allows you to download this simple report into a CSV file.
Ensuring All Data Is Imported
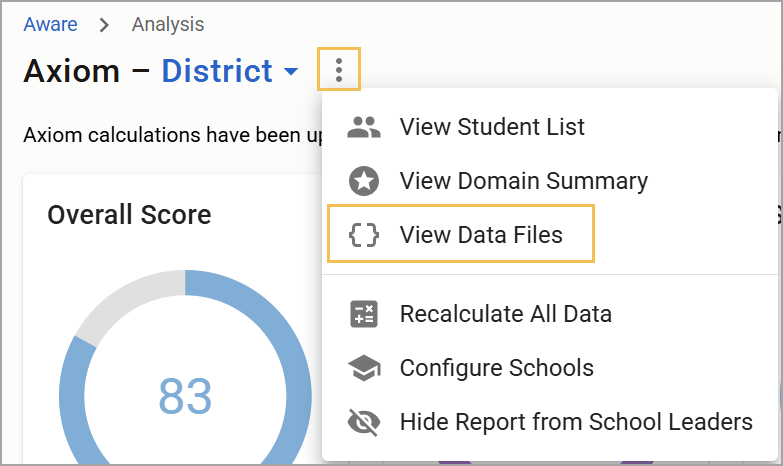
Select View Data Files () from the three vertical dots () to confirm that all data files have been imported.
.png)
Reimporting Data Files
In the event you need to reimport a data file because you are missing data or the most recent file version, follow these steps:
Navigate to the Analysis Settings gear () in Aware, select Upload Test Files, then select the History tab.
Select all of this year’s state files, then select Re-Import File.
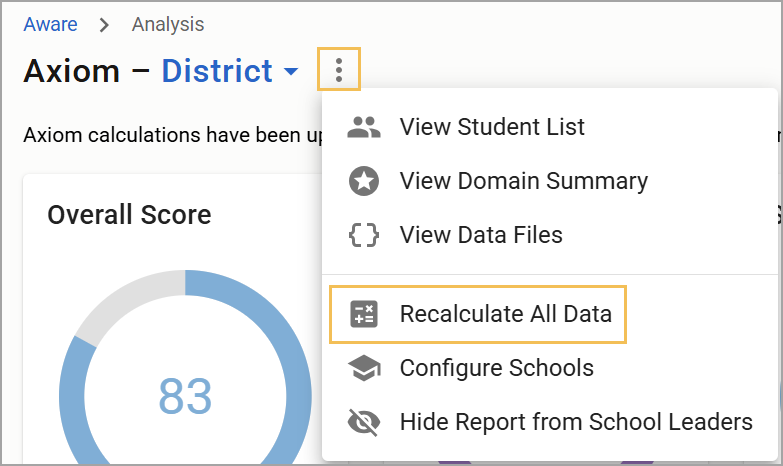
After reimporting, navigate to Axiom (), then select Recalculate All Data ().
Ensure you have imported the following files into Aware:
All SAT data files from Summer 2025 to Summer 2026
STAAR Alternate 2 2026
STAAR EOC Summer 2025 Administration
STAAR EOC Fall 2025 Administration
STAAR EOC Spring 2026 Administration
STAAR Grades 3-8 Spring 2026 Administration
TELPAS 2026
TELPAS Alternate 2026
2025 SDR (SIRS) files for any students taking EOC exams in the 2025-26 cycle
Note: SAT files are required for High School Domain 1 STAAR Component scores. ACT data files from Summer 2025 to Summer 2026 are recommended but not required.
The Consolidated Accountability File (CAF) is not necessary and not required for Axiom to work.
The Axiom home screen shows the last time a data recalculation occurred. This is most helpful to determine whether a recalculation might be necessary if the district has uploaded data recently.
Recalculate Accountability Predictions
Select Recalculate All Data () from the three vertical dots () on the Axiom home screen. This step reloads the data.
You must Recalculate All Data if you
import test files,
re-import test files,
modify campus settings,
modify Domain 1 Components, or
modify Domain 3 Components.
Caution: Only click Recalculate All Data once; multiple clicks disrupt the calculation process.
If you import or reimport files or if Domain 1 data is added, a warning banner will appear, reminding you to Recalculate All Data. This does not mean you need to reimport STAAR files. Instead, you need to click Recalculate All Data.
Caution: As updates as made to the software and new data is provided in the data files, it is critical to reimport all state test files and then select Recalculate All Data. This is your first option when troubleshooting. Reimport, then recalculate.
Configure Schools
Select Configure Schools () from the three vertical dots () to add CCMR data or manually change the numbers or selections made. While the numbers here originate from TEA resources, you might have access to your most up-to-date, most accurate data for these fields and need to make changes accordingly.
Select the Upload CCMR Data button () to upload the CCMR CSV report from TEAL.
Under the Type column, confirm that each school and district has the appropriate designation. Then, open the drop-down menu next to each school to make any necessary changes.
Adjust any information in the Eco Dis % column if needed. Check that the two lowest performing Racial/Ethnic Groups are correct in the 1st Group and 2nd Group columns (order does not matter). Make any corrections using their respective drop-down menus.
.png)
Note: For the 2026 accountability year, districts must configure the Previous Year ELP performance for Domain 3 for each school. TEA updated how the ELP for Domain 3 calculated ELP status, applied those updates to 2025 for data comparison purposes, and sent the updated scores to schools through TEAL. The publicly available Domain 3 scores were not updated with the new, recalculated ELP scores for 2025.
Select More under the Actions column to input Graduation Rate and CCMR information for each applicable campus. Type in Domain 1 and Domain 3 Components for the selected school or district.
.png)
Learn more about locating and inputting Domain 1 and Domain 3 Components.
Domain 3 Student Lists
To access Domain 3 student lists, select Closing the Gaps from the Axiom home screen.
When analyzing E.L. Proficiency in Domain 3: Closing the Gaps, click on a number in the Raw Pct column to see a list of students who took the TELPAS/TELPAS Alt. Reviewing this column can help users identify specific student groups and troubleshoot potential gaps in Axiom calculations (such as missing imported data due to missing students).
.png)
After clicking a percentage under Raw Pct, the user sees a list of all students who took TELPAS or TELPAS Alt. To see only the students included in the calculation, click Show Only Qualifying.
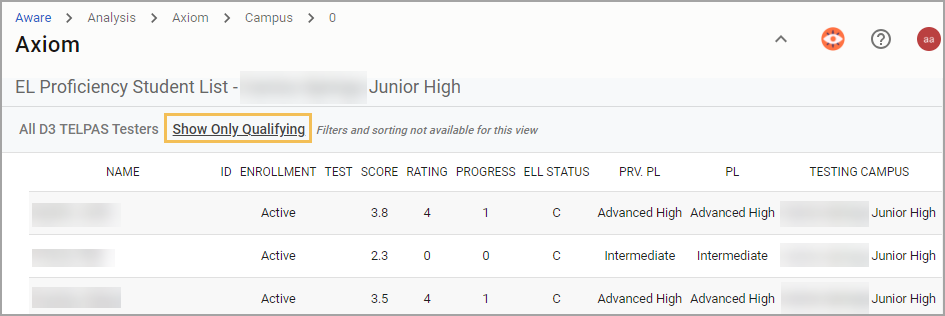
Note: Student lists generated from the Domain 3 table are not filterable.
For more information about Axiom, check out these resources: