Axiom users with the Analyze Accountability Data right can filter data to identify students in specific groups. This article explains how to use the filters and what types of information might be sorted in each data column.
Once you’ve identified a group of students, you can print or export the list to Excel. Additionally, you can create a Monitor Group.
Accessing Data Tables
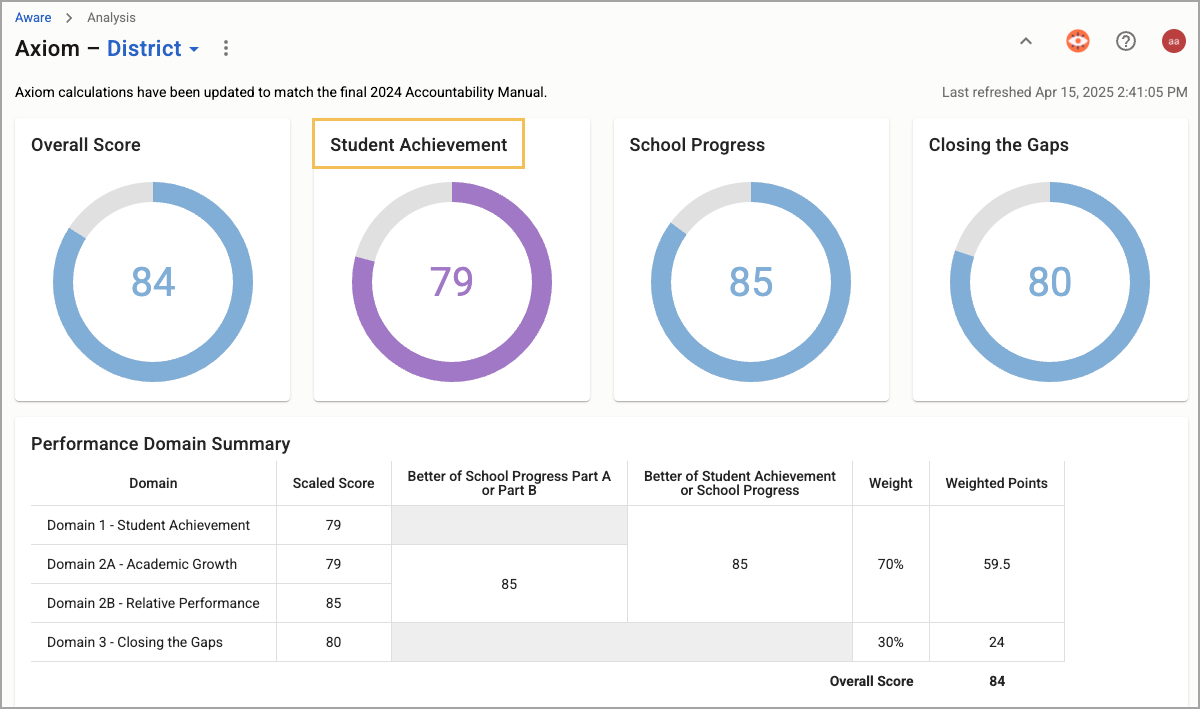
To access your data tables and begin using filters, select Student Achievement.
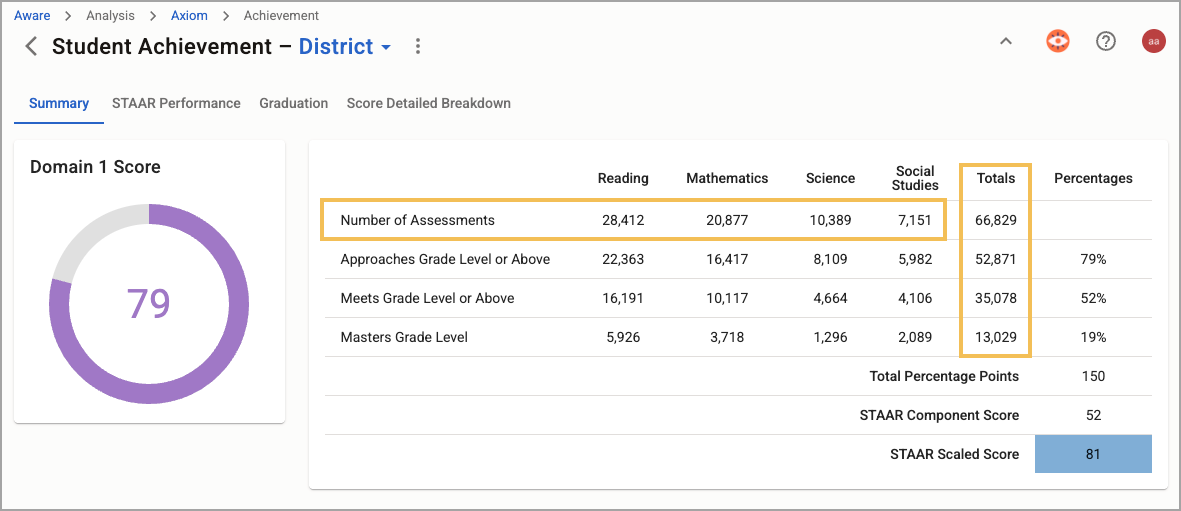
From the Domain 1: Student Achievement page, scroll to the STAAR Scores section and select a numeric field from the table. To view all student assessments, begin with the number that represents the Number of Assessments row and the Totals column. The title on the corresponding page reflects the initial data selection.
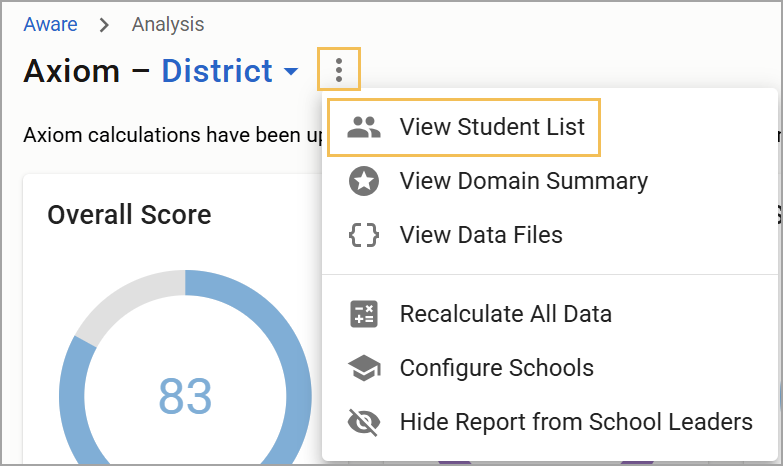
In addition, you can select View Student List () to see which student-level results you can use to create Monitor Groups for Aware.
Available Filters
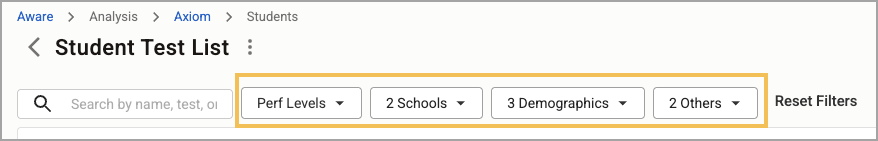
Fields with available filters are shown above the student list table.
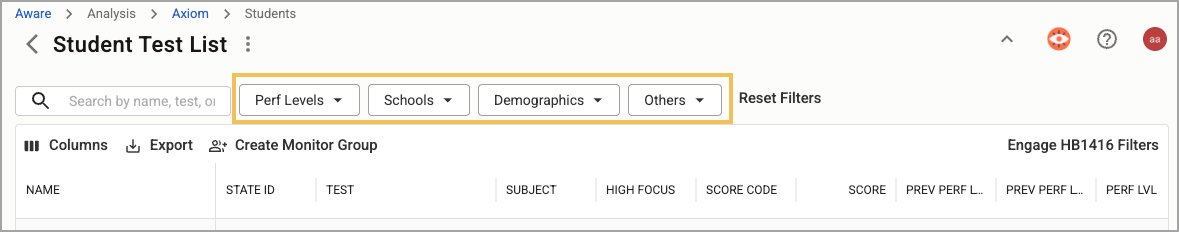
Each field has a set of filters you can apply to the table. For example, the Demographics field allows you to filter by Grade Level, Student Identifier, Ethnicity, Economic Disadvantage, and Emergent Bilingual options. Select one or more of each filter to apply to the table and select Apply.
As you filter your list, the filter tiles update to include information related to the filter selections.
If you want to filter the list to show only students who qualify under HB1416, select the Engage HB1416 button.
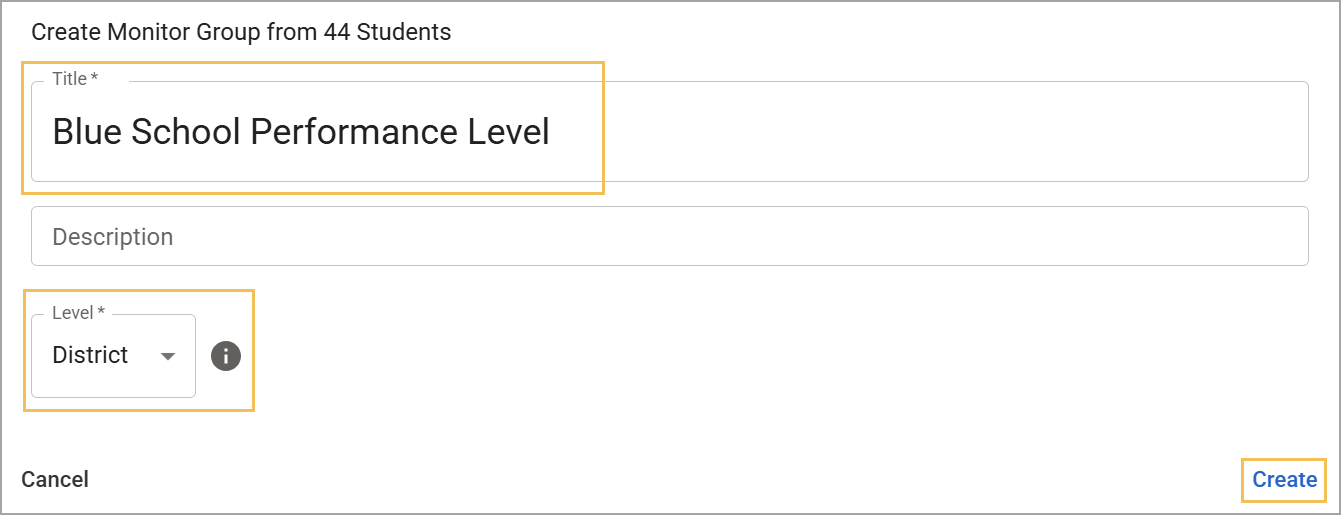
Once you have identified a group of students, you can print the corresponding list, export the list to Excel, or create a Monitor Group from the list.
If you select Create Monitor Group (), you must title the group and determine whether it is a District, Campus, or Personal Monitor Group before selecting Create.
For more information about Axiom, check out these resources: