The Detailed Analysis feature helps district and school leaders configure evaluation data to identify skew and areas of need for evaluators and educators. One of the most important factors in a successful evaluation process is ensuring evaluators understand their rubric. With appraisal analysis, a district or school leader can view evaluation data at different levels to identify skew and areas to address.
You can learn more about connecting evaluation documents to frameworks to create Detailed Analysis results. For the appraisal analysis to run correctly, questions must be connected to the dimensions of a framework, such as T-TESS, and be in matrix format. You can also learn more about using the Document Summary feature.
Quick Guide
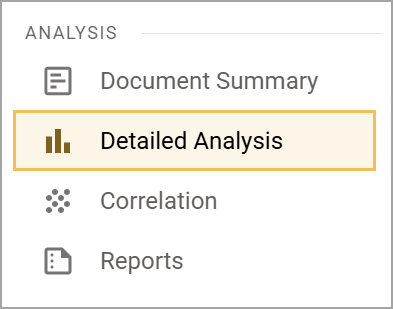
In the Analysis section of the navigation panel, select Detailed Analysis ().
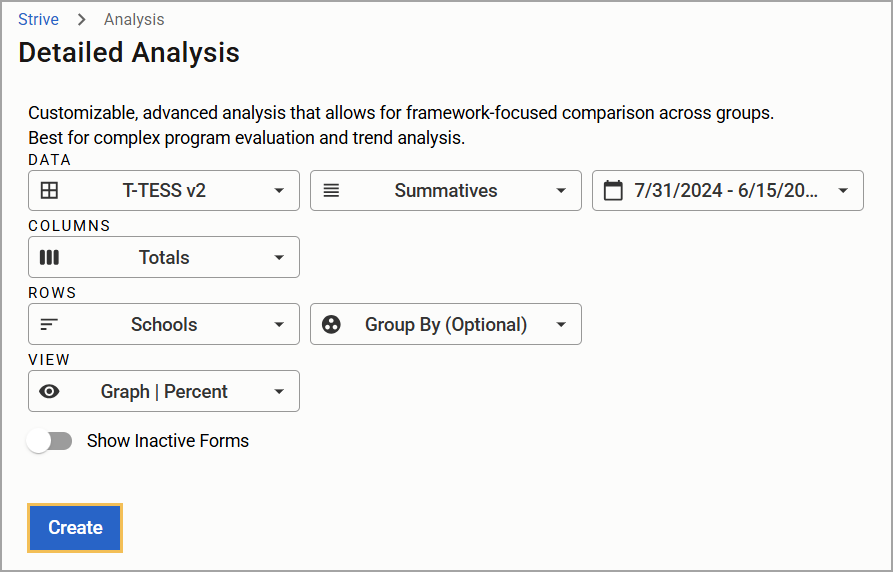
Use the drop-down menus to select the Data, Columns, Rows, and View that you want to appear on the analysis.
Select Create.
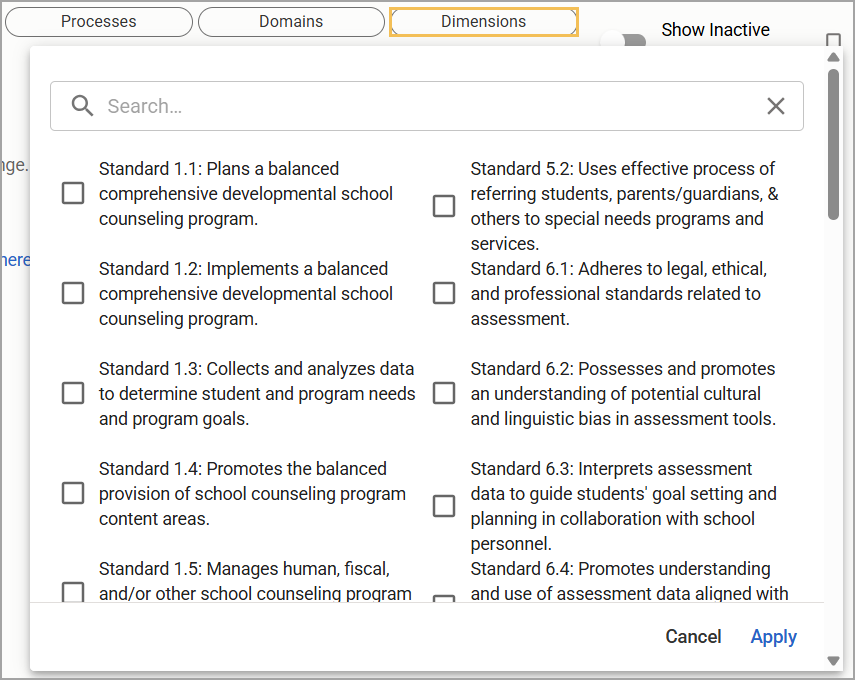
Use the filter option on the next page to further refine the data by Schools, Evaluators, Subjects, Grade Levels, Processes, Domains, Dimensions, and Documents.
Select the View filter and select Graph | Percent, Table | Percent, or Table | Score to change the data view.
To export the table data into a report, select Table | Percent or Table | Score, and then select the Download icon ().
Illustrated Guide
Step 1: In the Analysis section of the navigation panel, select Detailed Analysis ().
Step 2: Use the drop-down menus to select the Data, Columns, Rows, and View that you want to appear on the analysis. You can also include an optional Group By field. Select how the data will be displayed under View. You can view the data by Table | Score, Table | Percent, or Graph | Percent.
Tip: Toggle on the Show Inactive Forms option to include data from inactive forms.
Step 3: Select Create.
Step 4: Use the filter option on the next page to further refine the data by Schools, Evaluators, Subjects, Grade Levels, Processes, Domains, Dimensions, and Documents.
.png)
Caution: Subjects and Grade Levels are captured directly in evaluation documents. If the evaluator does not add those fields to the evaluations, the data appears as Not Set.
Step 5: Select the View filter and select Graph | Percent, Table | Percent, or Table | Score to change the data view.
Step 6: To export the table data into a report, select Table | Percent or Table | Score, and then select the Download icon ().
.png)
Filtering Suggestions by Role
You can combine filters to provide valuable information depending on your needs.
To create basic, high-level views, district leaders can filter:
Evaluators by School
Subject by School
School leaders can filter:
Staff Members by Evaluator
Staff Members by Subject or Grade
Subjects or Grade Levels by Evaluators
For example, the Dimensions filter might be used by a district leader who wants to check rubric calibration across the district or by a school leader across departments.
You can learn more about finding and analyzing data in Strive by watching the recorded webinar below.