Reports provide a way to view statistics about the department and and labor (if enabled).
Ticket Export
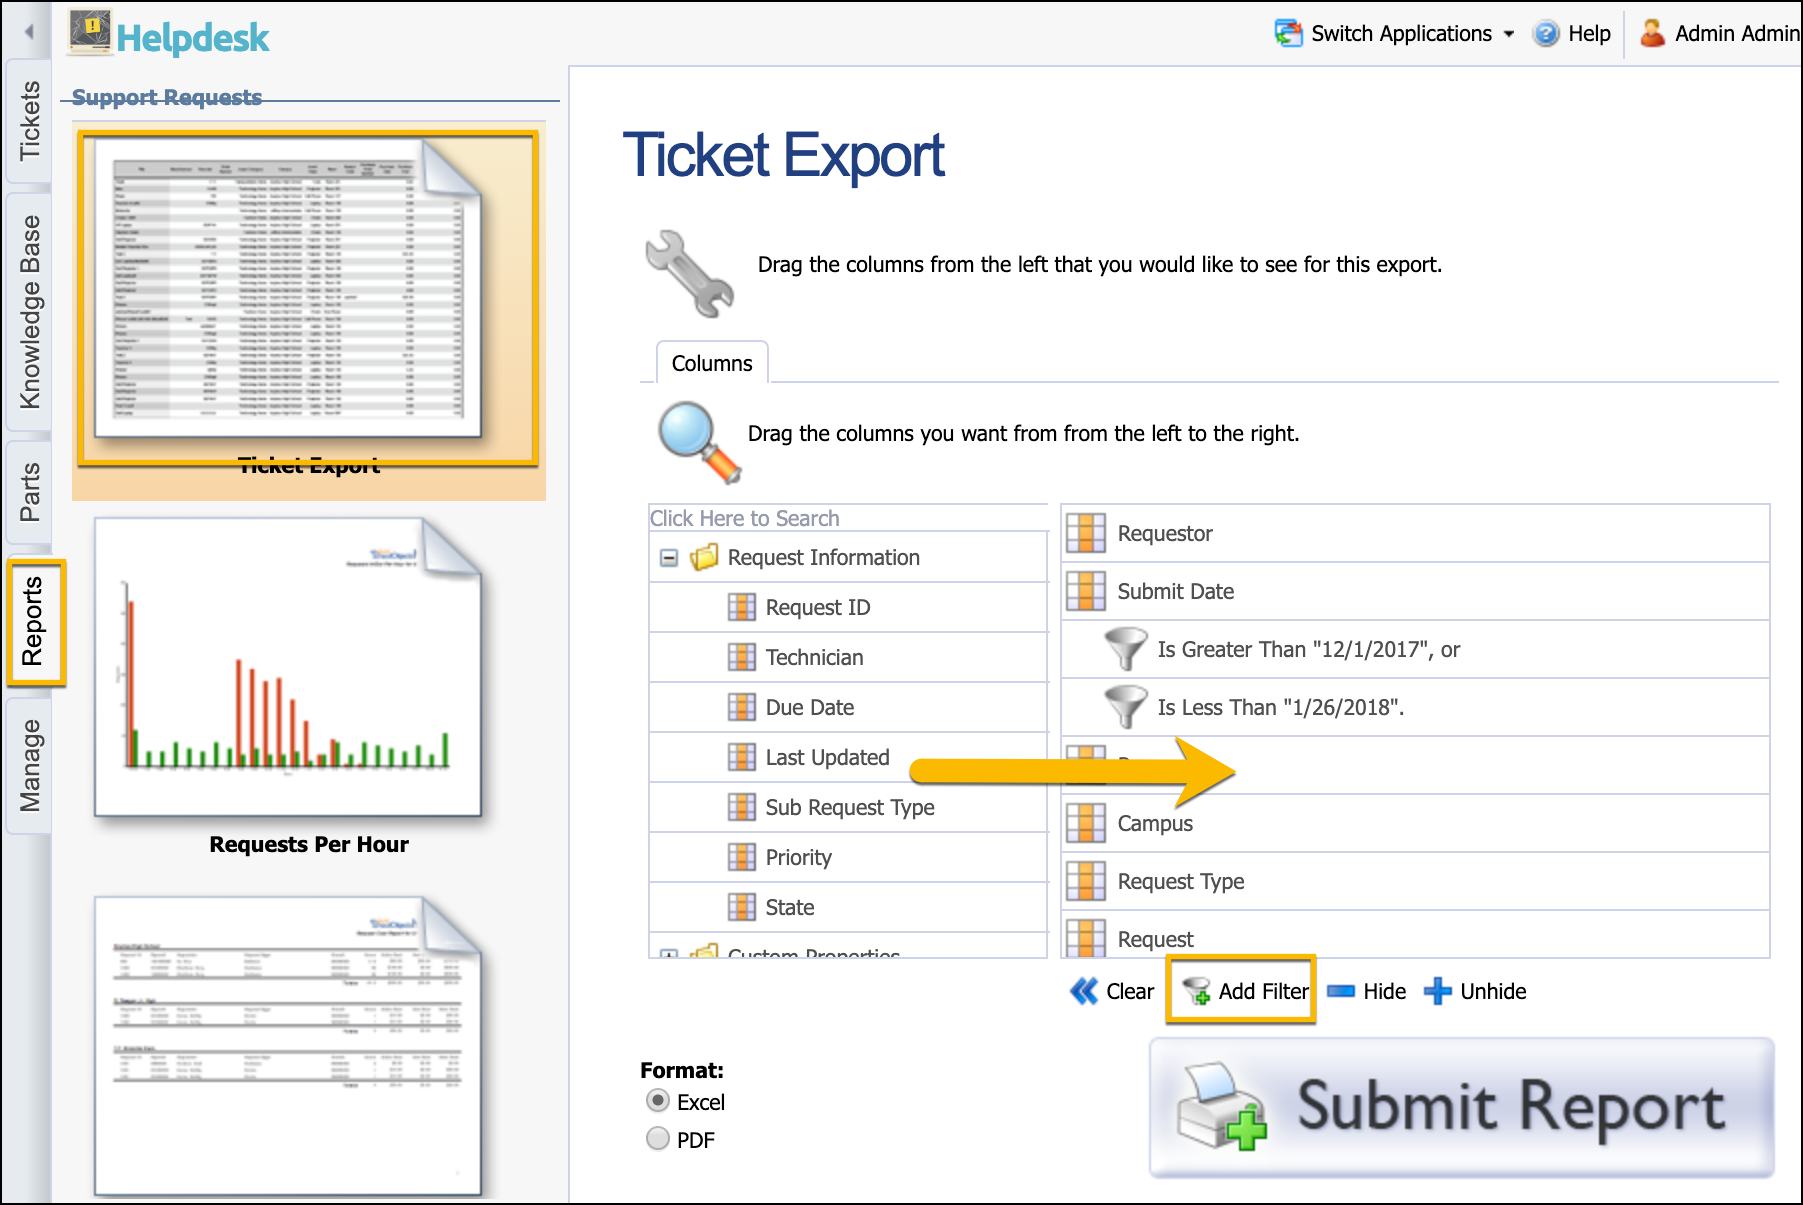
Ticket Export creates a customized report created by dragging column headers from the left to the right for what you want to include in the report. You can apply filters by selecting a column title and clicking the Add Filter button. This report can be exported in spreadsheet or PDF options.

Requests Per Hour
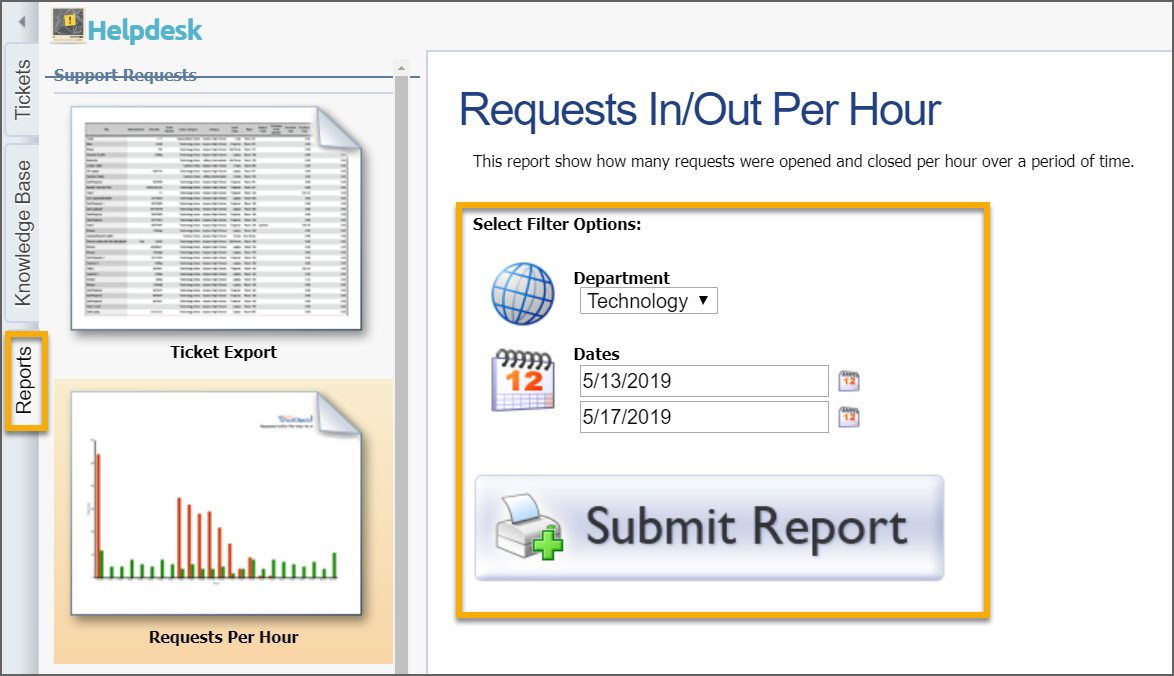
The Requests Per Hour report allows you to view, by department, how many requests were opened and closed per hour over a period of time. This is a useful report for determining how many staff to have on hand at particular times. Select your department from the drop-down box and select the dates. Click Submit Report.

Technician Statistics
This is an onscreen report view of a specific technician's statistics. Each technician can click on this option to view their own statistical data including number of open tickets, average resolution time, work hours (if tracking) and satisfaction ratings (if surveys used).
Use the options on the right to determine view based on Campuses or Request Type.

Department Statistics
This is also an onscreen report view for statistics by campus, technician, or request type for the entire department over time. Select the time frame by selecting the dates and choose Campus, Technician, or Request Type. Click Submit Report.

Technician Labor
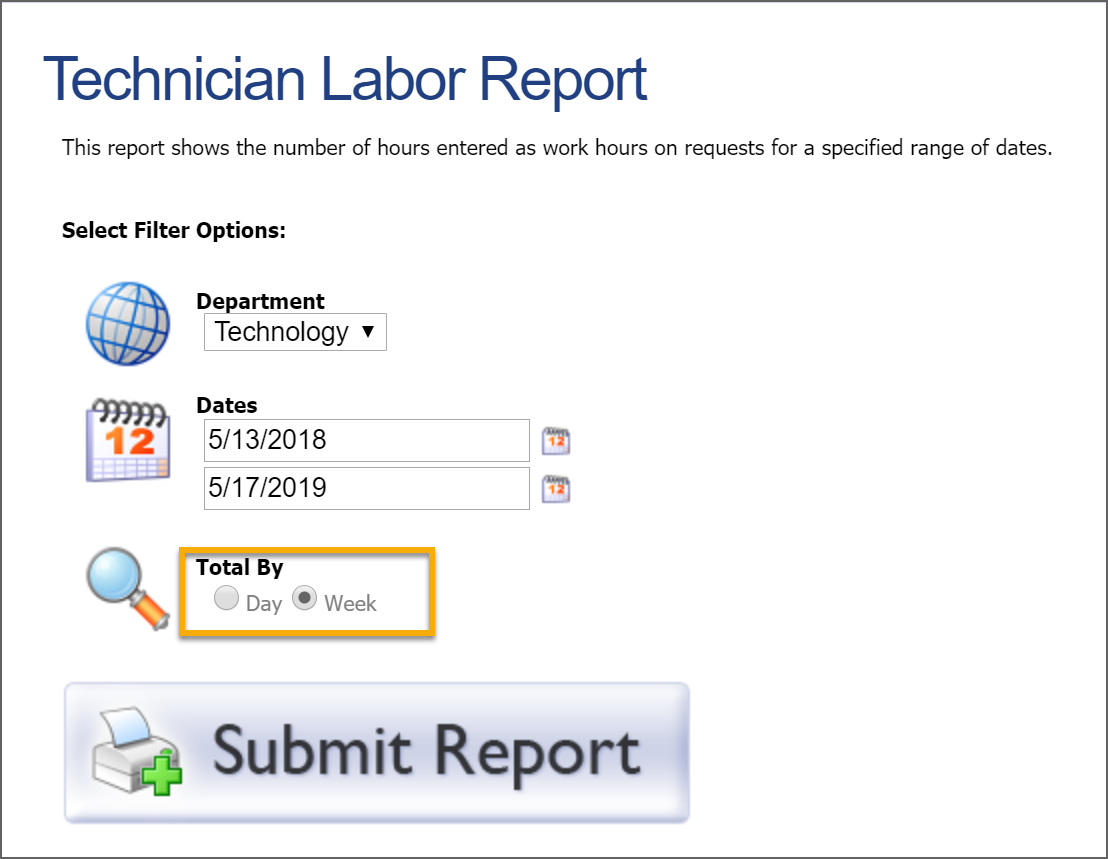
The Technician Labor report allows you to print, by department, the number of hours entered as work hours on requests for a specified range of dates. Select the department, enter a date range, and choose how the report will be totaled - by day or by week. Click Submit Report.
