By clicking on the Reports tab on the left side of the interface, Helpdesk managers can view support requests, statistics, parts, and license information.
Ticket Export
A fully customized report utilizing drag-and-drop columns from left to right that can be exported as a spreadsheet or PDF. Apply filters by selecting a column title on the right and click the Add Filter button.
Click Reports tab.
Select Ticket Export report.
Drag columns you want from the left to the right.
Select a column then click the Add Filter button to apply filtering.
Select export format - Excel or PDF.
Click Submit Report.
.png)
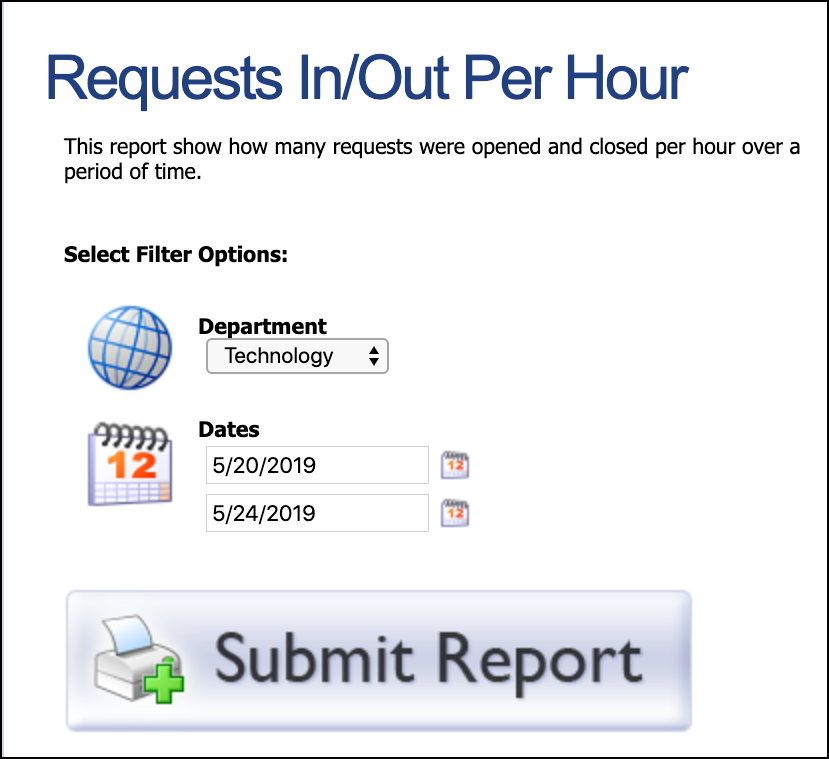
Requests Per Hour
Provides view, by department, of how many requests were opened and closed per hour over time.
Select your department from the drop-down menu.
Select the start and end dates for the report.
Click Submit Report.
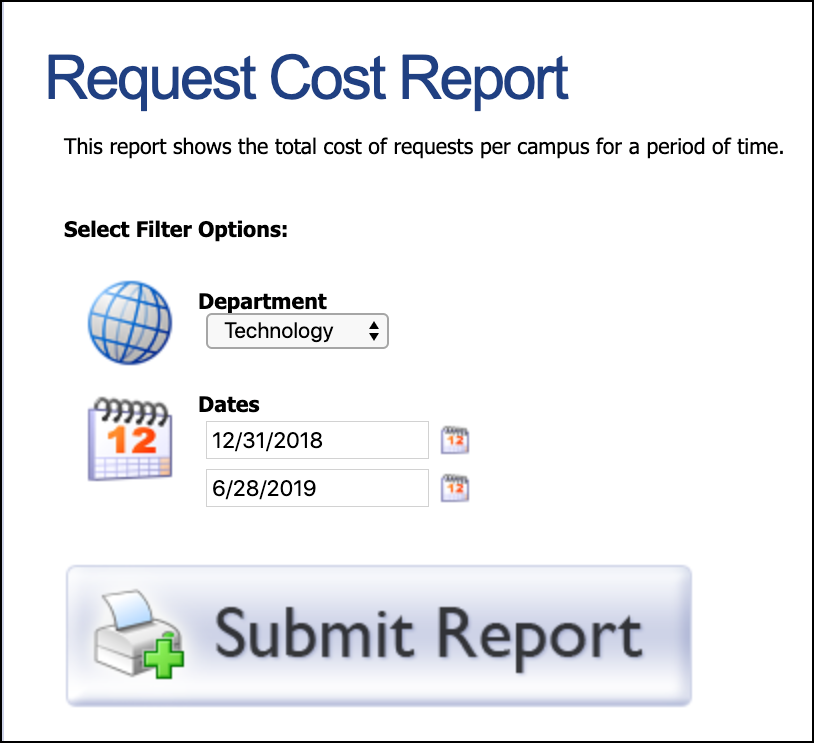
Request Cost
Provides a view of total cost of requests per campus for a period of time.
Select your department from the drop-down menu.
Select the start and end dates for the report.
Click Submit Report.
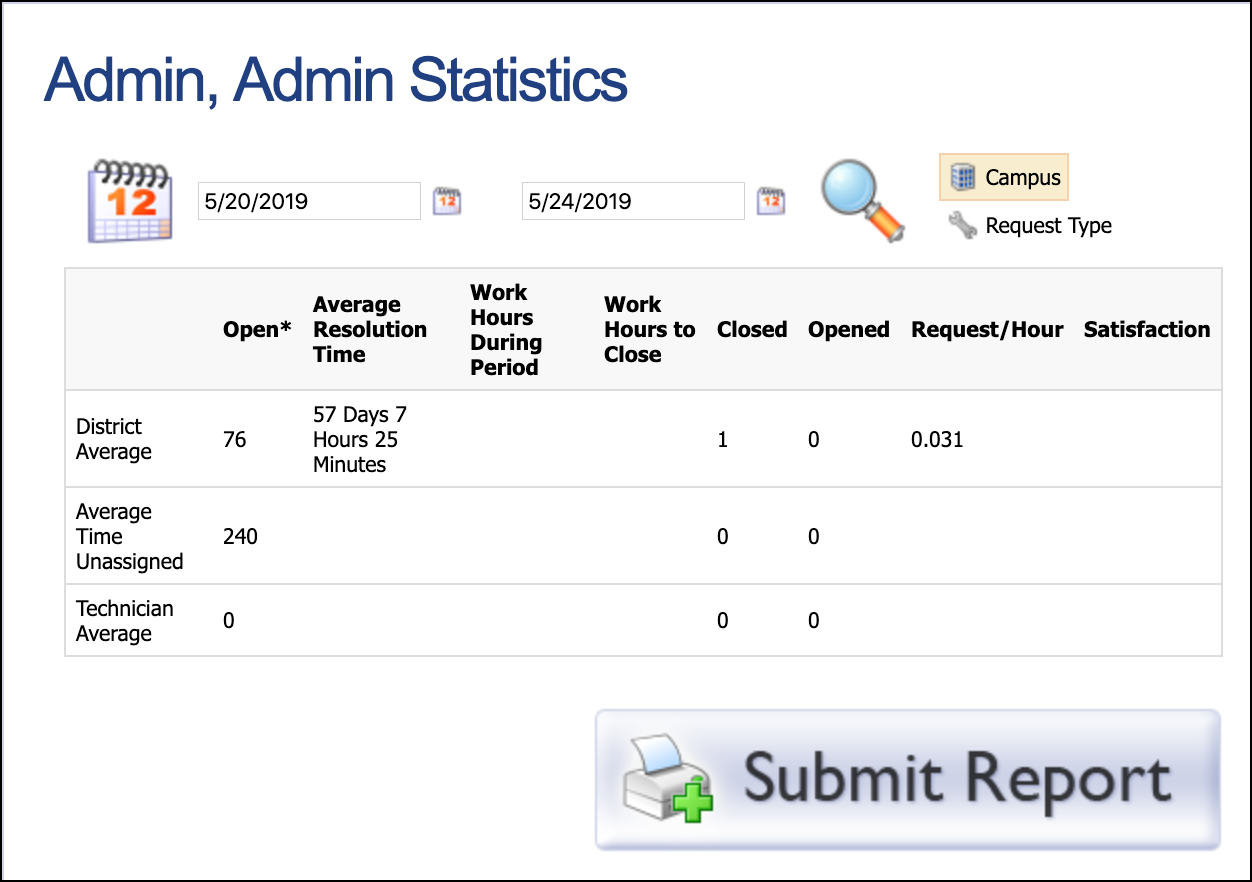
Technician Statistics
Provides a view of statistics by campus or request type over a period of time.
Select Campus or Request Type.
Select start and end dates.
Click Submit Report.
You can drill down further to view more detailed statistics by clicking on campus, request type, or technician name. On each level, you can change your views between technician and request type.
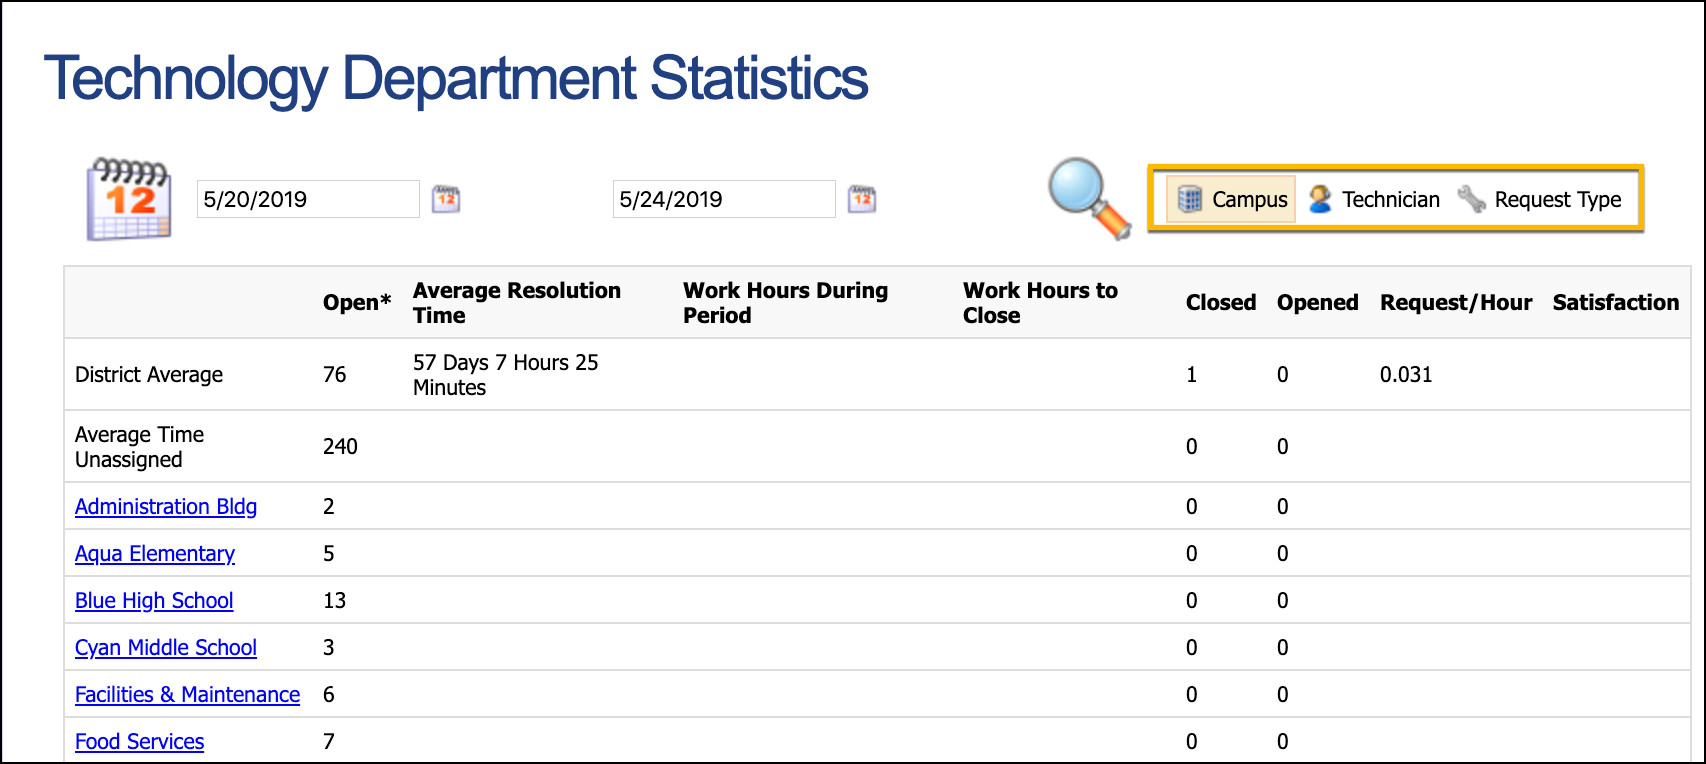
Department Statistics
Provides a view of statistics by campus, technician, or request type over a period of time.
Select the time frame by dates.
Choose Campus, Technician, or Request Type.
Click Submit Report.
Click through linked names, campuses, or request types to view more information.
Technician Labor
Provides a view, by department, the number of hours entered as work hours on requests for a specified range of dates.
Select the department.
Enter a date range.
Choose whether the report totals by day or by week.
Click Submit Report.
Real Asset Cost
Provides a view detailed real cost of ownership analysis for an asset class and category from Facilities & Events.
Select the department.
Select a category and class.
Click Submit Report.
Parts Inventory
Provides a view of the inventory of parts by department.
Select the department.
Click Submit Report.
Part Usage
Provides a view of how many parts were used from the Parts Store for a range of dates. Totals can be shown by Location, Campus, or Category.
Select the department.
Enter a date range.
Select how you want information grouped: location, campus, or category.
Click Submit Report.
All Licenses
Provides a view of all licenses for a department.
Select the department.
Option to Show All includes expired licenses.
Click Submit Report.