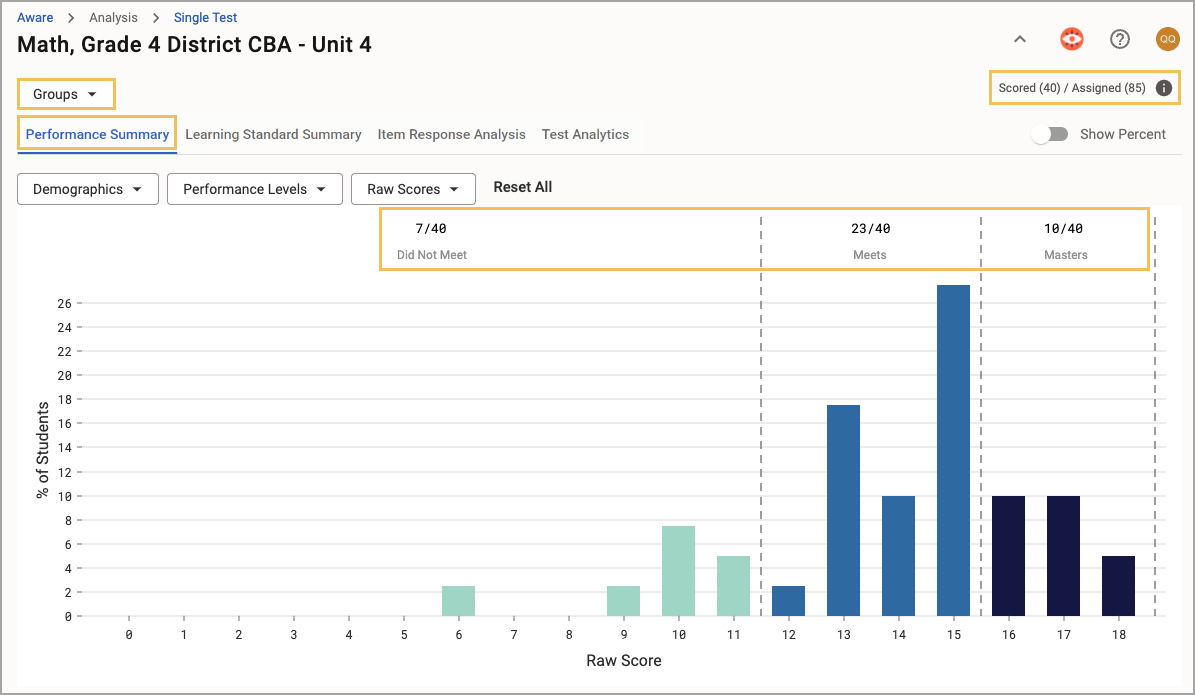
The Performance Summary tab in Single Test Analysis helps teachers quickly assess the number of students at each performance level, along with their raw scores. This information can help teachers determine whether there are any abnormal patterns regarding student performance levels on a specific test.
In addition to harnessing the Performance Summary data, you can create a monitor group from a curated student list.
Harnessing the Performance Summary
As you navigate the Performance Summary, you will see the number of tests scored out of the number of tests assigned to students. These numbers are live and change as more tests are scored. The dataset changes to reflect your drop-down menu selections if you choose multiple courses as a teacher or multiple schools and testing instructors as an administrator.
Note: The analysis will not include data from students who have yet to take the test or if there are unscored constructed response questions.
Step 1: Determine if you want to narrow down the test data.
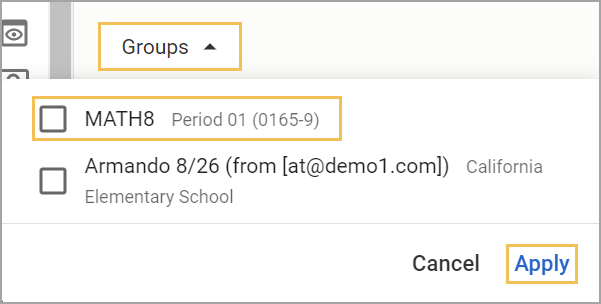
Teachers can filter the data by class period. Select class periods under the Groups drop-down menu and click Apply. The bar chart defaults to include scored test data from all class periods.
If you do not want to apply the Groups filter, proceed to Step 2.
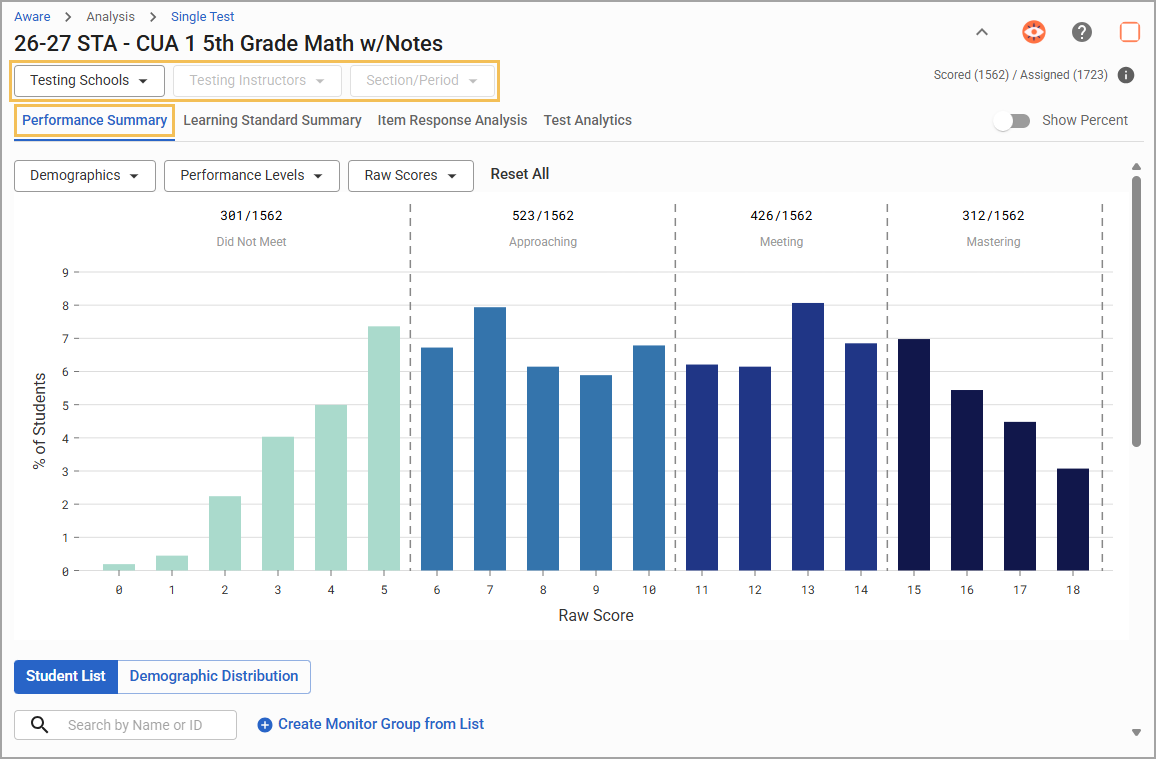
Administrators with data view rights can filter the data by the testing schools, instructors, or section/period. Select the school(s) under the Testing Schools drop-down menu, and click Apply. From there, navigate to the Testing Instructors drop-down menu to filter by the instructor if desired. Finally, use the Section/Period drop-down menu to filter by sections if desired. Make your selections and click Apply. The bar chart defaults to include scored test data from all schools and instructors.
Note: You can use the Testing Instructors and Section/Period filters only by selecting one testing school at a time. However, once you’ve selected your school, you can then select multiple instructors or sections.
If you do not want to apply Testing Schools, Testing Instructors, or Sections/Period filters, proceed to Step 2.
Step 2: Examine the bar chart. The y-axis shows the % of Students within the district’s configured performance levels.
Note: An Aware data administrator can set the names of up to six performance levels, including Performance Level 0, for their district to use across all local assessment test types.
The x-axis shows the Raw Score. By default, the bar chart displays the number of students who qualify for a performance level out of the total possible. For example, the number of students who fall into the Meeting performance level could be 426 out of 1,562.
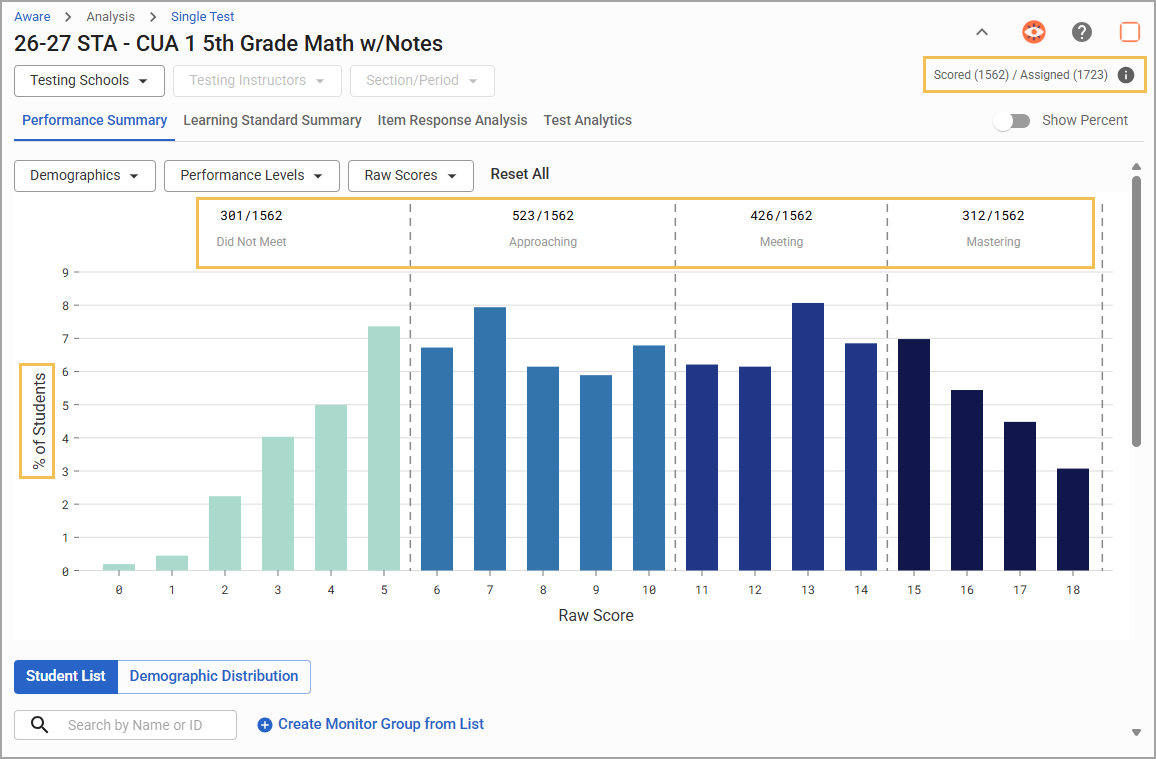
Toggle on Show Percent to display these numbers as a percentage instead. For example, the percentage of students who fall into the Meets performance level could be 45% of the total number of students.
.png)
Click on each performance level section of the bar chart to highlight the same performance level column under the Student List and Demographic Distribution below.
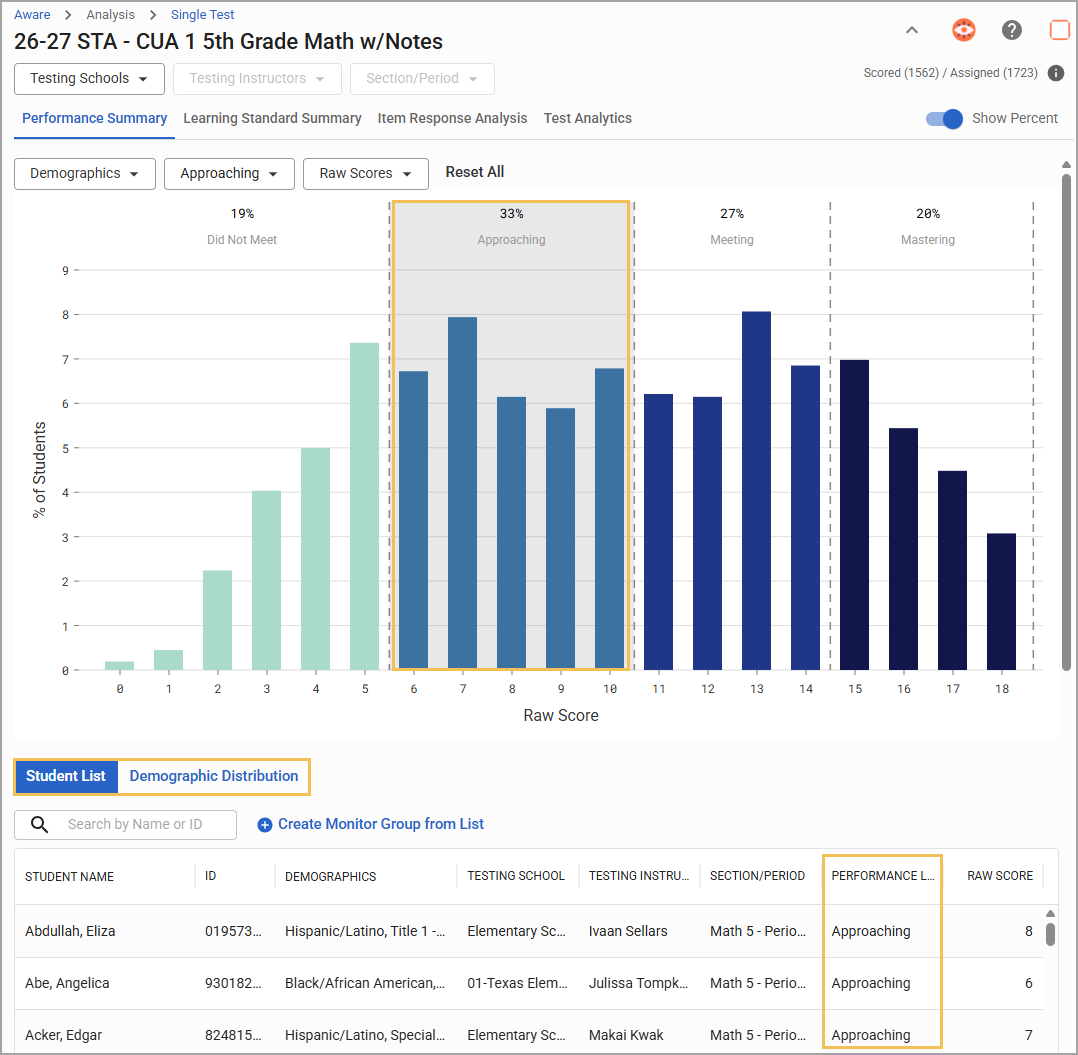
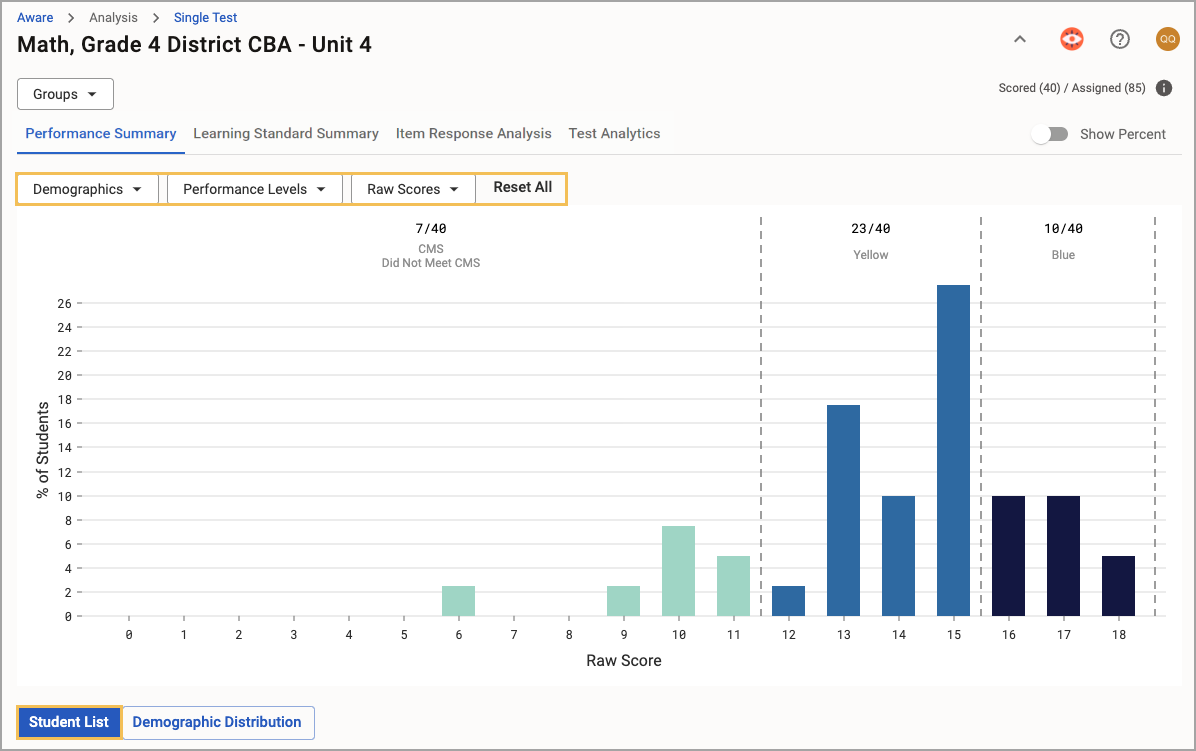
Step 3: Use the Student List and the associated Performance Summary filters to identify groups of students and find patterns in performance. The filter options include the following:
Demographics
Performance Levels
Raw Scores
The Demographics filter splits further to include the following subfilters:
Grade Level
Student Identifiers (GT, Homeless, Migrant, Section 504, Special Education Indicator)
Ethnicity
Economically Disadvantaged (if available based on district settings and user rights)
ESL
Emergent Bilingual
RTI
Title 1
Career and Technology Ed
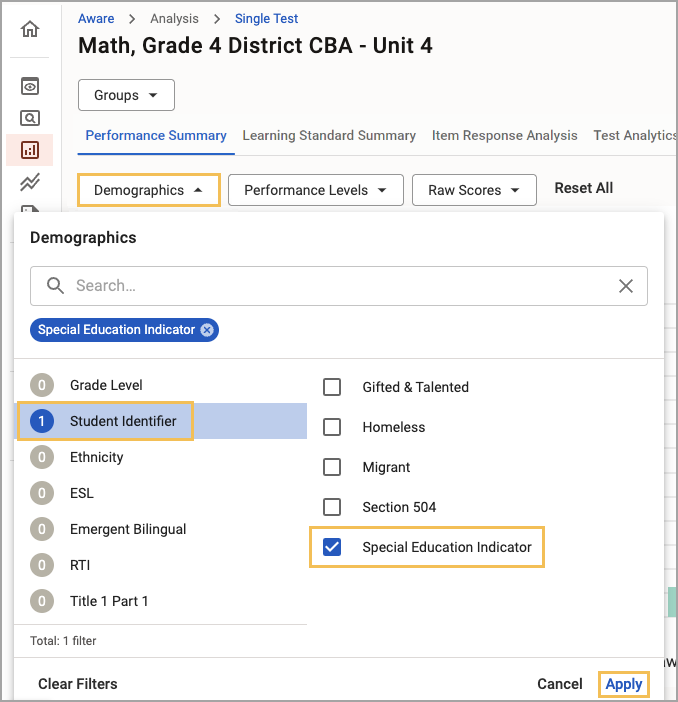
Each filter includes options to select one or a combination of options to allow a fully customized student list. Selections in the filters will modify the graph and the student table.
Note: The performance level filter will include all enabled performance levels for the assessment, regardless if students achieved a performance level in the assessment results.
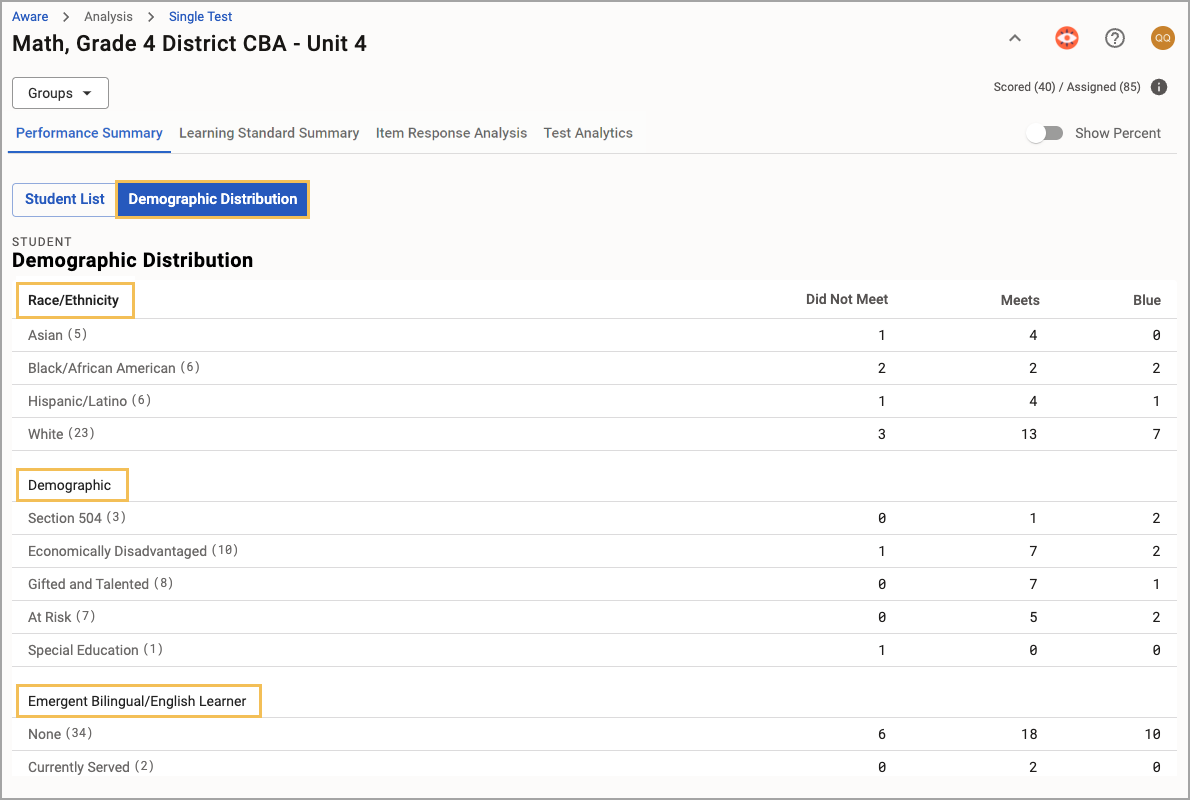
Step 4: Explore student data more granularly with the Demographic Distribution information beneath the graph. The student data offers three distribution categories to explore:
Race/Ethnicity
Demographic
Emergent Bilingual/English Learner
Every subcategory displays the number of students contained within each one. For example, the At Risk student group could show 7 students. However, since the data is live, the number could rise if the teacher grades more tests.
Creating a Monitor Group From the Student List Table
As an optional step after you’ve curated a list of students, you can create a monitor group that includes the students in the student list table.
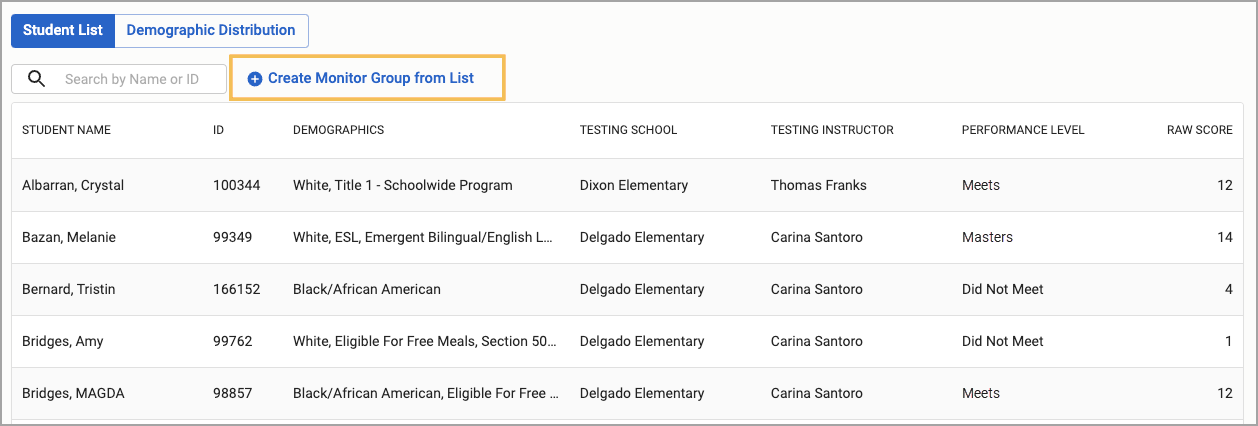
Step 1: Select Create Monitor Group from List to open the creation modal.
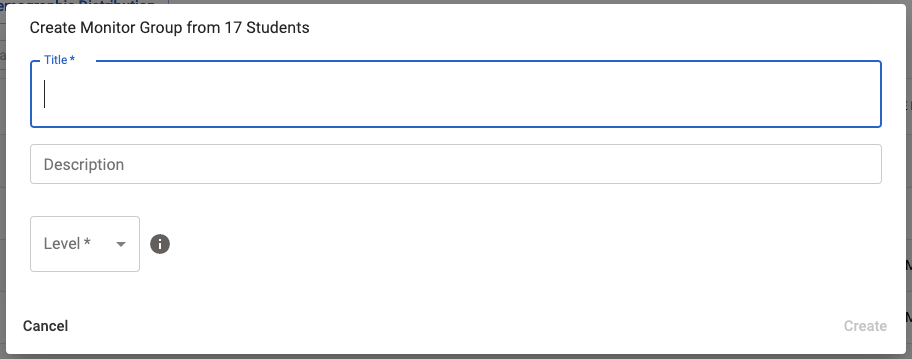
Step 2: Type in a title and description, then select the monitor group’s level from District, School, or Personal. Select Create when ready. Teachers can only create personal monitor groups.
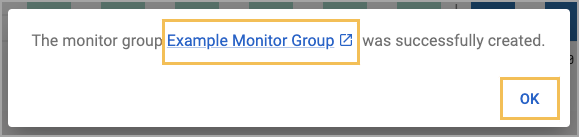
Step 3: Either select OK to continue working in Single Test Analysis, or click the monitor group’s link to edit the group in a new browser tab.